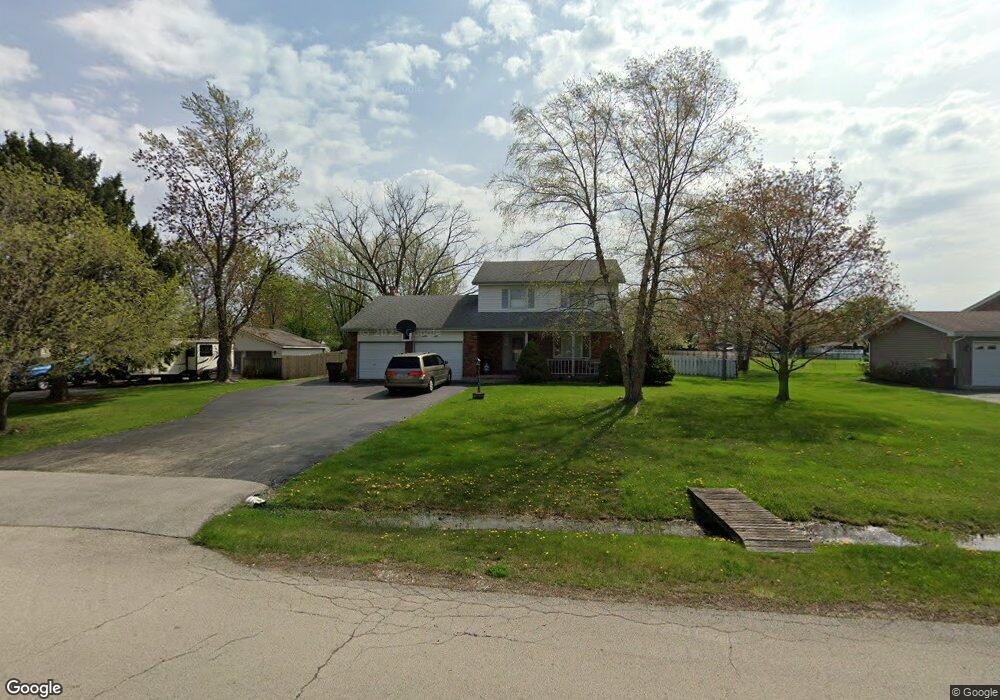
1808 Briarcliff Dr New Lenox, IL 60451
Estimated Value: $311,000 - $403,689
3
Beds
2
Baths
--
Sq Ft
0.67
Acres
About This Home
This home is located at 1808 Briarcliff Dr, New Lenox, IL 60451 and is currently estimated at $375,672. 1808 Briarcliff Dr is a home located in Will County with nearby schools including Spencer Trail, Spencer Pointe, and Spencer Crossing Intermediate School.
Ownership History
Date
Name
Owned For
Owner Type
Purchase Details
Closed on
Sep 4, 2020
Sold by
Wesselhoff Gary L R
Bought by
Wesselhoff Carla D
Current Estimated Value
Purchase Details
Closed on
Jul 14, 2010
Sold by
The Bank Of New York Mellon
Bought by
Johnson Carol D and Wesselhoff Gary L
Purchase Details
Closed on
Jan 20, 2010
Sold by
Redmond David M and Case #08 Ch 2536
Bought by
The Bank Of New York Mellon and The Bank Of New York
Purchase Details
Closed on
Oct 21, 2004
Sold by
Redmond David M
Bought by
Redmond David M and Redmond Robin R
Home Financials for this Owner
Home Financials are based on the most recent Mortgage that was taken out on this home.
Original Mortgage
$171,738
Interest Rate
5.82%
Mortgage Type
FHA
Purchase Details
Closed on
Nov 19, 1993
Sold by
Redmond David M and Redmond Robin R
Bought by
Redmond David M
Create a Home Valuation Report for This Property
The Home Valuation Report is an in-depth analysis detailing your home's value as well as a comparison with similar homes in the area
Home Values in the Area
Average Home Value in this Area
Purchase History
| Date | Buyer | Sale Price | Title Company |
|---|---|---|---|
| Wesselhoff Carla D | -- | Attorney | |
| Johnson Carol D | $119,000 | First American Title | |
| The Bank Of New York Mellon | -- | None Available | |
| Redmond David M | -- | Ticor Title | |
| Redmond David M | -- | -- |
Source: Public Records
Mortgage History
| Date | Status | Borrower | Loan Amount |
|---|---|---|---|
| Previous Owner | Redmond David M | $171,738 |
Source: Public Records
Tax History Compared to Growth
Tax History
| Year | Tax Paid | Tax Assessment Tax Assessment Total Assessment is a certain percentage of the fair market value that is determined by local assessors to be the total taxable value of land and additions on the property. | Land | Improvement |
|---|---|---|---|---|
| 2024 | $5,154 | $103,660 | $35,744 | $67,916 |
| 2023 | $5,154 | $94,494 | $32,583 | $61,911 |
| 2022 | $5,548 | $87,052 | $30,017 | $57,035 |
| 2021 | $5,989 | $81,870 | $28,230 | $53,640 |
| 2020 | $5,796 | $78,949 | $27,223 | $51,726 |
| 2019 | $5,948 | $76,501 | $26,379 | $50,122 |
| 2018 | $5,805 | $73,863 | $25,469 | $48,394 |
| 2017 | $5,506 | $71,740 | $24,737 | $47,003 |
| 2016 | $5,340 | $69,820 | $24,075 | $45,745 |
| 2015 | $5,164 | $67,622 | $23,317 | $44,305 |
| 2014 | $5,164 | $66,787 | $23,029 | $43,758 |
| 2013 | $5,164 | $67,687 | $23,339 | $44,348 |
Source: Public Records
Map
Nearby Homes
- 911 Canongate Ln
- 22559 S Country Ln
- 500 E Laraway Rd
- 550 E Laraway Rd
- 2185 Bristol Park Rd
- 1990 Edgeview Dr
- 2019 Royalglen Dr
- 2125 Sky Harbor Dr
- 2124 Sky Harbor Dr
- 2067 Edgeview Dr
- 2164 Sky Harbor Dr
- 2166 Sky Harbor Dr
- LOT 8 W Laraway Rd
- 575 Caledonia Dr
- 2980 Oak Rail Dr
- Raleigh Plan at Calistoga
- Siena II Plan at Calistoga
- Galveston Plan at Calistoga
- Brooklyn Plan at Calistoga
- Ontario Plan at Calistoga
- 1900 Briarcliff Dr
- 1804 Briarcliff Dr
- 1401 Briarcliff Dr
- 1405 Briarcliff Dr
- 1404 Corrie Ln
- 1400 Corrie Ln
- 1408 Corrie Ln
- 1809 Briarcliff Dr
- 1409 Briarcliff Dr
- 1813 Briarcliff Dr
- 1805 Briarcliff Dr
- 1901 Briarcliff Dr
- 1809 S Anderson Rd
- 1412 Corrie Ln
- 1805 S Anderson Rd
- 1413 Briarcliff Dr
- 1312 Corrie Ln
- 1901 S Anderson Rd
- 1905 Briarcliff Dr
- 1801 S Anderson Rd