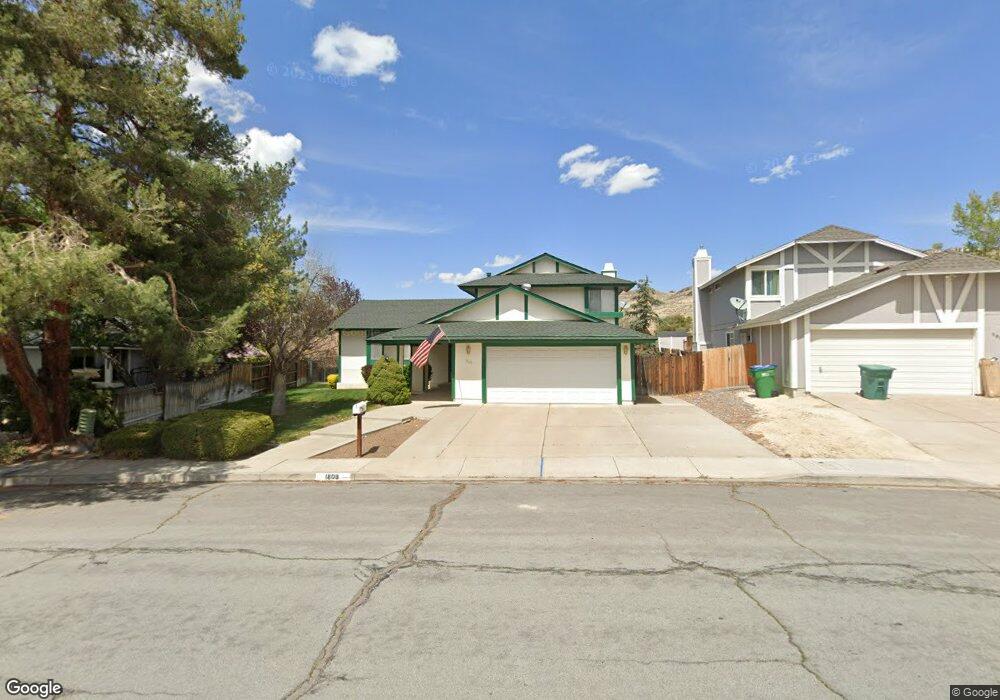
1808 Deep Creek Dr Sparks, NV 89434
Reed NeighborhoodEstimated Value: $501,706 - $574,000
4
Beds
3
Baths
2,128
Sq Ft
$255/Sq Ft
Est. Value
About This Home
This home is located at 1808 Deep Creek Dr, Sparks, NV 89434 and is currently estimated at $543,427, approximately $255 per square foot. 1808 Deep Creek Dr is a home located in Washoe County with nearby schools including Hershal H. Beam Elementary School, Jerry Whitehead Elementary School, and Lou Mendive Middle School.
Ownership History
Date
Name
Owned For
Owner Type
Purchase Details
Closed on
Jun 1, 2021
Sold by
Lovell Jimmy C
Bought by
Lovell Jimmy C and Lovell Revocable Trust
Current Estimated Value
Purchase Details
Closed on
Sep 28, 2016
Sold by
Lovell Jimmy C and Lovell Jim
Bought by
Lovell Jimmy C
Home Financials for this Owner
Home Financials are based on the most recent Mortgage that was taken out on this home.
Original Mortgage
$25,000
Outstanding Balance
$18,158
Interest Rate
3.43%
Mortgage Type
Future Advance Clause Open End Mortgage
Estimated Equity
$525,269
Purchase Details
Closed on
Feb 14, 1996
Sold by
Lovell Patricia
Bought by
Lovell Jim
Purchase Details
Closed on
Jun 15, 1995
Sold by
Lovell Patricia J and Lehnert Ardyth V
Bought by
Lovell Patricia J
Create a Home Valuation Report for This Property
The Home Valuation Report is an in-depth analysis detailing your home's value as well as a comparison with similar homes in the area
Home Values in the Area
Average Home Value in this Area
Purchase History
| Date | Buyer | Sale Price | Title Company |
|---|---|---|---|
| Lovell Jimmy C | -- | None Available | |
| Lovell Jimmy C | -- | First American Title Ins C | |
| Lovell Jim | -- | -- | |
| Lovell Patricia J | -- | -- |
Source: Public Records
Mortgage History
| Date | Status | Borrower | Loan Amount |
|---|---|---|---|
| Open | Lovell Jimmy C | $25,000 |
Source: Public Records
Tax History Compared to Growth
Tax History
| Year | Tax Paid | Tax Assessment Tax Assessment Total Assessment is a certain percentage of the fair market value that is determined by local assessors to be the total taxable value of land and additions on the property. | Land | Improvement |
|---|---|---|---|---|
| 2025 | $2,064 | $76,593 | $36,120 | $40,473 |
| 2024 | $2,006 | $74,807 | $33,215 | $41,592 |
| 2023 | $2,006 | $75,316 | $35,175 | $40,142 |
| 2022 | $1,948 | $60,841 | $26,740 | $34,101 |
| 2021 | $1,893 | $56,232 | $21,735 | $34,497 |
| 2020 | $1,836 | $55,846 | $20,720 | $35,126 |
| 2019 | $1,783 | $55,322 | $20,720 | $34,602 |
| 2018 | $1,728 | $48,728 | $14,455 | $34,273 |
| 2017 | $1,681 | $48,545 | $13,720 | $34,825 |
| 2016 | $1,637 | $48,135 | $12,250 | $35,885 |
| 2015 | $1,635 | $46,906 | $10,325 | $36,581 |
| 2014 | $1,588 | $44,491 | $9,030 | $35,461 |
| 2013 | -- | $42,168 | $6,860 | $35,308 |
Source: Public Records
Map
Nearby Homes
- 3222 Myles Dr
- 3253 Clan Alpine Dr
- 3127 Montezuma Way
- 3345 Groom Way
- 1557 Satellite Dr
- 1688 Round Mountain Cir
- 2763 Blossom View Dr
- 1790 Desert Mountain Dr
- 2688 Laguna Way
- 1792 Braidwood Dr
- 2411 Tecumseh Way Unit 12
- 2415 Tecumseh Way Unit 11
- 4393 Acobat Ct
- 1472 Giannotti Dr
- 2479 Napoli Dr
- 3375 Culpepper Dr
- 4383 Setting Sun Ct Unit 1
- Plan 4 at Eagle Peak
- Plan 5 at Eagle Peak
- Plan 2 at Eagle Peak
- 1818 Deep Creek Dr
- 1768 Deep Creek Dr
- 1828 Deep Creek Dr
- 1738 Deep Creek Dr
- 1819 Deep Creek Dr
- 1838 Deep Creek Dr
- 3473 Good Hope Ln
- 1718 Deep Creek Dr
- 1829 Deep Creek Dr
- 1848 Deep Creek Dr
- 3463 Good Hope Ln
- 1839 Deep Creek Dr
- 3444 Good Hope Ln
- 1858 Deep Creek Dr
- 3453 Good Hope Ln
- 1849 Deep Creek Dr
- 3376 Silverhorn Ln
- 3424 Good Hope Ln
- 1868 Deep Creek Dr
- 3386 Silverhorn Ln