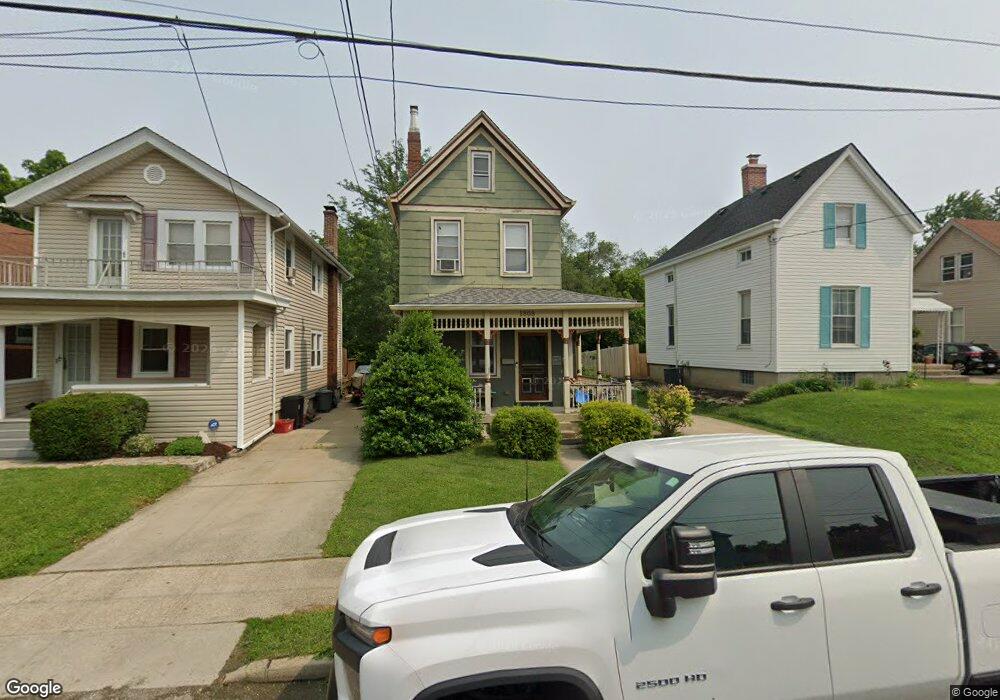
1808 Elm Ave Cincinnati, OH 45212
Estimated Value: $200,000 - $238,000
3
Beds
1
Bath
1,902
Sq Ft
$112/Sq Ft
Est. Value
About This Home
This home is located at 1808 Elm Ave, Cincinnati, OH 45212 and is currently estimated at $212,984, approximately $111 per square foot. 1808 Elm Ave is a home located in Hamilton County with nearby schools including Norwood High School, Cornerstone Christian Academy, and Immaculate Conception Academy.
Ownership History
Date
Name
Owned For
Owner Type
Purchase Details
Closed on
Sep 3, 2013
Sold by
Kidd Barry
Bought by
Hensey Sean
Current Estimated Value
Home Financials for this Owner
Home Financials are based on the most recent Mortgage that was taken out on this home.
Original Mortgage
$83,129
Outstanding Balance
$61,199
Interest Rate
4.37%
Mortgage Type
FHA
Estimated Equity
$151,785
Purchase Details
Closed on
Mar 29, 1996
Sold by
Schalk Eric L and Schalk Teresa A
Bought by
Plummer Todd
Home Financials for this Owner
Home Financials are based on the most recent Mortgage that was taken out on this home.
Original Mortgage
$62,800
Interest Rate
7.36%
Create a Home Valuation Report for This Property
The Home Valuation Report is an in-depth analysis detailing your home's value as well as a comparison with similar homes in the area
Home Values in the Area
Average Home Value in this Area
Purchase History
| Date | Buyer | Sale Price | Title Company |
|---|---|---|---|
| Hensey Sean | $86,000 | Attorney | |
| Plummer Todd | $78,500 | -- |
Source: Public Records
Mortgage History
| Date | Status | Borrower | Loan Amount |
|---|---|---|---|
| Open | Hensey Sean | $83,129 | |
| Previous Owner | Plummer Todd | $62,800 |
Source: Public Records
Tax History
| Year | Tax Paid | Tax Assessment Tax Assessment Total Assessment is a certain percentage of the fair market value that is determined by local assessors to be the total taxable value of land and additions on the property. | Land | Improvement |
|---|---|---|---|---|
| 2025 | $2,894 | $55,962 | $11,067 | $44,895 |
| 2023 | $2,887 | $55,962 | $11,067 | $44,895 |
| 2022 | $2,307 | $37,559 | $7,434 | $30,125 |
| 2021 | $2,245 | $37,559 | $7,434 | $30,125 |
| 2020 | $2,250 | $37,559 | $7,434 | $30,125 |
| 2019 | $2,134 | $32,946 | $6,521 | $26,425 |
| 2018 | $2,137 | $32,946 | $6,521 | $26,425 |
| 2017 | $2,015 | $32,946 | $6,521 | $26,425 |
| 2016 | $1,908 | $30,101 | $6,129 | $23,972 |
| 2015 | $1,701 | $30,101 | $6,129 | $23,972 |
| 2014 | $1,696 | $30,101 | $6,129 | $23,972 |
| 2013 | $1,923 | $34,507 | $6,521 | $27,986 |
Source: Public Records
Map
Nearby Homes
- 1819 Maple Ave
- 1827 Maple Ave
- 1808 Maple Ave
- 1812 Tilden Ave
- 1762 Cleveland Ave
- 1816 Cleveland Ave
- 1701 Sherman Ave
- 1907 Crown Ave
- 1952 Maple Ave
- 1901 Sherman Ave
- 4635 Baker St
- 4719 Section Ave
- 3 Baker Cir
- 1841 Mills Ave
- 2005 Crown Ave
- 2030 Elm Ave
- 2043 Lawrence Ave
- 1354 Avon Dr
- 2049 Sherman Ave
- 1945 Lawn Ave
Your Personal Tour Guide
Ask me questions while you tour the home.