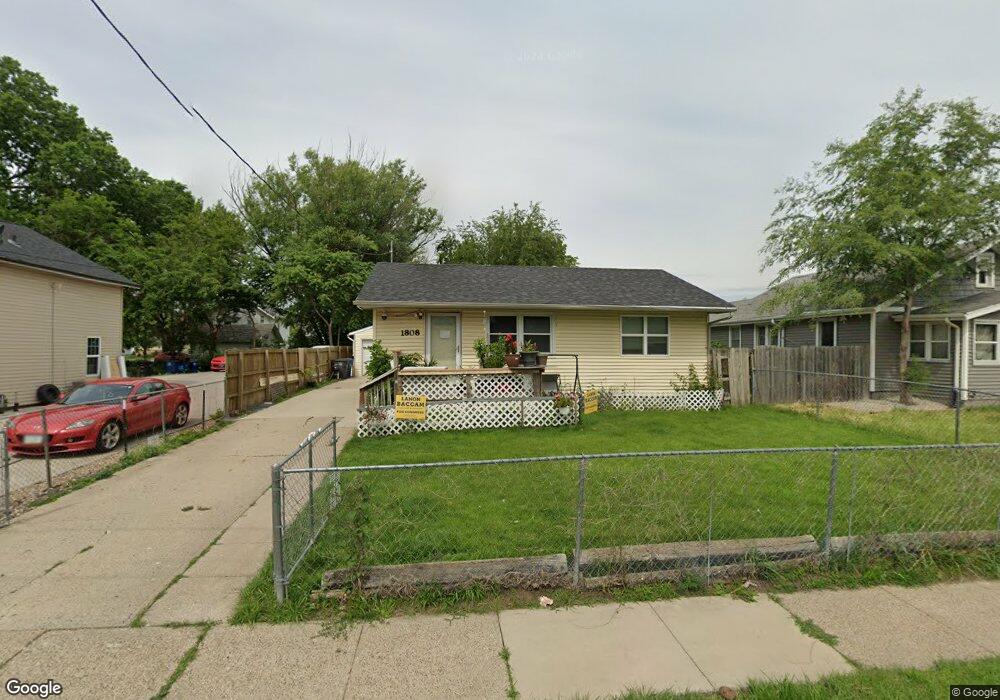
1808 Lay St Des Moines, IA 50317
Fairmont Park NeighborhoodEstimated Value: $172,000 - $204,000
4
Beds
1
Bath
832
Sq Ft
$227/Sq Ft
Est. Value
About This Home
This home is located at 1808 Lay St, Des Moines, IA 50317 and is currently estimated at $188,847, approximately $226 per square foot. 1808 Lay St is a home located in Polk County with nearby schools including Phillips Elementary, Goodrell Middle School, and North High School.
Ownership History
Date
Name
Owned For
Owner Type
Purchase Details
Closed on
Oct 25, 2019
Sold by
Khamphanthong Pieng and Thong Paige
Bought by
Khamphanthong Pieng and Thong Paige
Current Estimated Value
Home Financials for this Owner
Home Financials are based on the most recent Mortgage that was taken out on this home.
Original Mortgage
$93,000
Outstanding Balance
$42,161
Interest Rate
3.7%
Mortgage Type
Closed End Mortgage
Estimated Equity
$146,686
Purchase Details
Closed on
Nov 22, 2009
Sold by
Mckean Christopher and Bartlett Tiana
Bought by
Khamphanthong Pieng
Home Financials for this Owner
Home Financials are based on the most recent Mortgage that was taken out on this home.
Original Mortgage
$93,279
Interest Rate
4.9%
Mortgage Type
FHA
Purchase Details
Closed on
Dec 13, 2002
Sold by
Pray Randy John and Pray Daleena Dee
Bought by
Mckean Christopher and Bartlett Tiana
Home Financials for this Owner
Home Financials are based on the most recent Mortgage that was taken out on this home.
Original Mortgage
$83,000
Interest Rate
6.23%
Create a Home Valuation Report for This Property
The Home Valuation Report is an in-depth analysis detailing your home's value as well as a comparison with similar homes in the area
Home Values in the Area
Average Home Value in this Area
Purchase History
| Date | Buyer | Sale Price | Title Company |
|---|---|---|---|
| Khamphanthong Pieng | -- | None Available | |
| Khamphanthong Pieng | $94,500 | Itc | |
| Mckean Christopher | $82,500 | -- |
Source: Public Records
Mortgage History
| Date | Status | Borrower | Loan Amount |
|---|---|---|---|
| Open | Khamphanthong Pieng | $93,000 | |
| Closed | Khamphanthong Pieng | $93,279 | |
| Previous Owner | Mckean Christopher | $83,000 |
Source: Public Records
Tax History
| Year | Tax Paid | Tax Assessment Tax Assessment Total Assessment is a certain percentage of the fair market value that is determined by local assessors to be the total taxable value of land and additions on the property. | Land | Improvement |
|---|---|---|---|---|
| 2025 | $2,880 | $178,400 | $19,100 | $159,300 |
| 2024 | $2,880 | $156,900 | $16,600 | $140,300 |
| 2023 | $2,610 | $156,900 | $16,600 | $140,300 |
| 2022 | $2,588 | $119,600 | $13,100 | $106,500 |
| 2021 | $2,438 | $119,600 | $13,100 | $106,500 |
| 2020 | $2,528 | $106,300 | $11,600 | $94,700 |
| 2019 | $2,190 | $106,300 | $11,600 | $94,700 |
| 2018 | $2,162 | $90,000 | $9,600 | $80,400 |
| 2017 | $2,146 | $90,000 | $9,600 | $80,400 |
| 2016 | $2,086 | $87,900 | $9,200 | $78,700 |
| 2015 | $2,086 | $87,900 | $9,200 | $78,700 |
| 2014 | $2,030 | $88,200 | $9,100 | $79,100 |
Source: Public Records
Map
Nearby Homes
- 1901 E 23rd St
- 1821 E 25th St
- 1614 Searle St
- 1410 E 23rd St
- 2113 E 21st St
- 2208 Tichenor St
- 1321 E 25th St
- 2324 E 23rd St
- 1517 Delaware Ave
- 2710 E Washington Ave
- 1312 E 25th Ct
- 2503 E 24th St
- 1311 E 25th Ct
- 2644 Chicago Ave
- 1415 Delaware Ave
- 2741 E Washington Ave
- 1411 Delaware Ave
- 2757 Easton Blvd
- 2707 Cleveland Ave
- 2539 E 23rd St
Your Personal Tour Guide
Ask me questions while you tour the home.