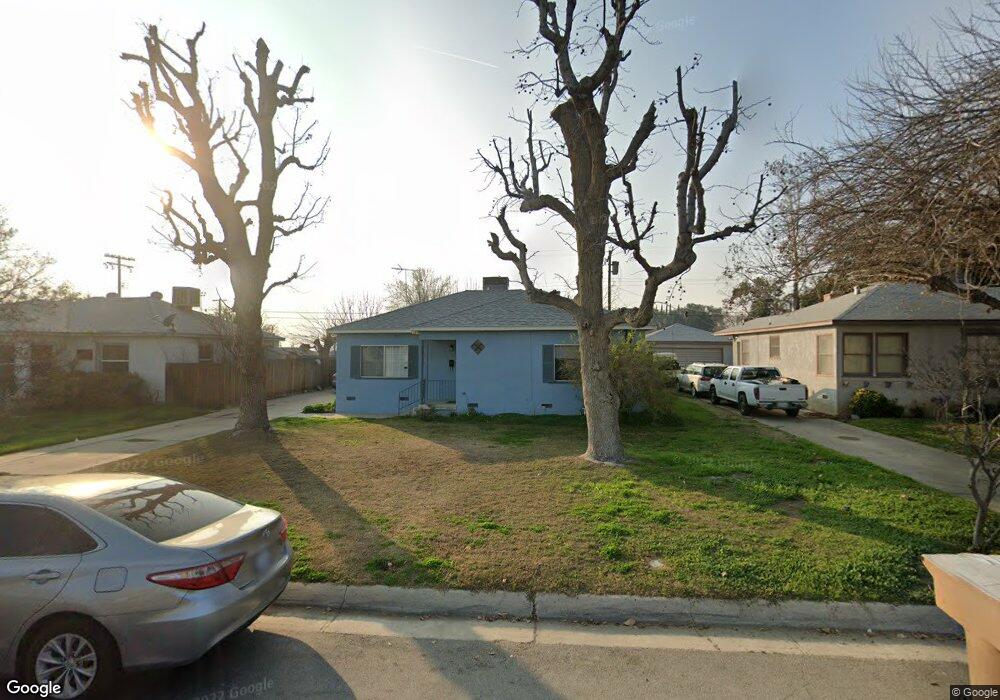
1808 Manley Ave Bakersfield, CA 93306
Estimated Value: $235,858 - $269,000
3
Beds
1
Bath
1,145
Sq Ft
$223/Sq Ft
Est. Value
About This Home
This home is located at 1808 Manley Ave, Bakersfield, CA 93306 and is currently estimated at $254,965, approximately $222 per square foot. 1808 Manley Ave is a home located in Kern County with nearby schools including Harding Elementary School, Compton Junior High School, and East Bakersfield High School.
Ownership History
Date
Name
Owned For
Owner Type
Purchase Details
Closed on
May 25, 2016
Sold by
Flores Cruz
Bought by
Flores Cruz and Cruz Flores Revocable Trust
Current Estimated Value
Home Financials for this Owner
Home Financials are based on the most recent Mortgage that was taken out on this home.
Original Mortgage
$52,300
Interest Rate
3.64%
Mortgage Type
New Conventional
Purchase Details
Closed on
Mar 20, 2014
Sold by
Flores Cruz and Cruz Flores Revocable Trust
Bought by
Vasquez Lorraine and Lopez Stephan
Purchase Details
Closed on
Aug 27, 2013
Sold by
Flores Cruz and Vasquez Cruz
Bought by
Flores Cruz and The Cruz Flores Revocable Trus
Purchase Details
Closed on
Jun 23, 2011
Sold by
Flores Cruz and Vazquez Cruz
Bought by
Flores Cruz
Home Financials for this Owner
Home Financials are based on the most recent Mortgage that was taken out on this home.
Original Mortgage
$54,888
Interest Rate
4.87%
Mortgage Type
FHA
Create a Home Valuation Report for This Property
The Home Valuation Report is an in-depth analysis detailing your home's value as well as a comparison with similar homes in the area
Home Values in the Area
Average Home Value in this Area
Purchase History
We collect this data history from publicly available records. To have your information removed, we recommend requesting removal directly through your county’s website.
| Date | Buyer | Sale Price | Title Company |
|---|---|---|---|
| Flores Cruz | -- | Accommodation | |
| Flores Cruz | -- | Placer Title Company | |
| Vasquez Lorraine | -- | None Available | |
| Flores Cruz | -- | None Available | |
| Flores Cruz | -- | Fidelity National Title Co |
Source: Public Records
Mortgage History
We collect this data history from publicly available records. To have your information removed, we recommend requesting removal directly through your county’s website.
| Date | Status | Borrower | Loan Amount |
|---|---|---|---|
| Closed | Flores Cruz | $52,300 | |
| Closed | Flores Cruz | $54,888 |
Source: Public Records
Tax History
| Year | Tax Paid | Tax Assessment Tax Assessment Total Assessment is a certain percentage of the fair market value that is determined by local assessors to be the total taxable value of land and additions on the property. | Land | Improvement |
|---|---|---|---|---|
| 2025 | $2,255 | $120,463 | $36,776 | $83,687 |
| 2024 | $2,188 | $118,102 | $36,055 | $82,047 |
| 2023 | $2,188 | $115,788 | $35,349 | $80,439 |
| 2022 | $2,095 | $113,518 | $34,656 | $78,862 |
| 2021 | $1,994 | $111,293 | $33,977 | $77,316 |
| 2020 | $1,956 | $110,153 | $33,629 | $76,524 |
| 2019 | $1,892 | $110,153 | $33,629 | $76,524 |
| 2018 | $1,840 | $105,877 | $32,324 | $73,553 |
| 2017 | $1,820 | $103,802 | $31,691 | $72,111 |
| 2016 | $1,585 | $101,768 | $31,070 | $70,698 |
| 2015 | $1,580 | $100,241 | $30,604 | $69,637 |
| 2014 | $1,451 | $92,000 | $23,000 | $69,000 |
Source: Public Records
Map
Nearby Homes
- 2417 Edwards Ave
- 1835 Corrientes St
- 2228 College Ave
- 2218 Lindora St
- 1819 Locust Ravine
- 2720 Edwards Ave
- 2712 Primera Vista
- 2708 College Ave
- 2525 Avenida Escuela
- 1607 Palm Dr
- 2305 Sandy Ln
- 2235 Pacific Dr
- 1744 Camino Sierra
- 1911 Flower St
- 2935 Shelly Ln
- 1893 Flower St
- 2814 College Ave
- 2109 Kent Dr
- 2512 Niles St
- 2107 Oregon St
- 1804 Manley Ave
- 1812 Manley Ave
- 1800 Manley Ave
- 1816 Manley Ave
- 1809 Morgan Ln
- 1819 Morgan Ln
- 1809 Manley Ave
- 1803 Morgan Ln
- 1825 Morgan Ln
- 1820 Manley Ave
- 1805 Manley Ave
- 1813 Manley Ave
- 1801 Manley Ave
- 1817 Manley Ave
- 1821 Morgan Ln
- 1824 Manley Ave
- 1821 Manley Ave
- 1829 Morgan Ln
- 1825 Manley Ave
- 1808 Shirlee Ct
Your Personal Tour Guide
Ask me questions while you tour the home.