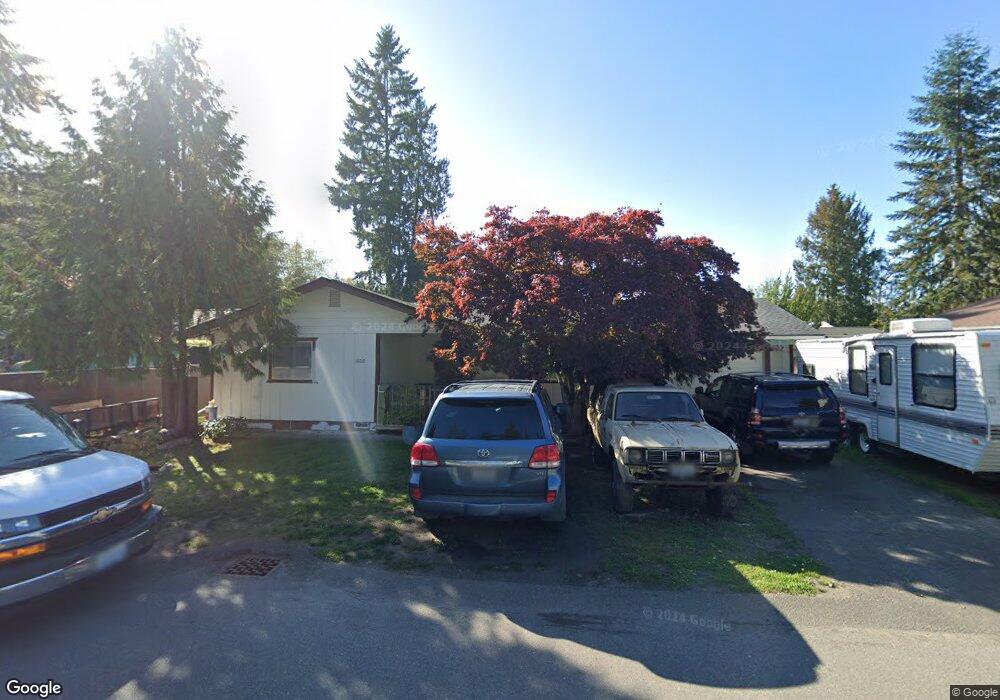
1808 Ricky Ct E Port Orchard, WA 98366
Manchester NeighborhoodEstimated Value: $393,000 - $419,412
3
Beds
1
Bath
1,120
Sq Ft
$365/Sq Ft
Est. Value
About This Home
This home is located at 1808 Ricky Ct E, Port Orchard, WA 98366 and is currently estimated at $408,603, approximately $364 per square foot. 1808 Ricky Ct E is a home located in Kitsap County with nearby schools including Manchester Elementary School, John Sedgwick Middle School, and South Kitsap High School.
Ownership History
Date
Name
Owned For
Owner Type
Purchase Details
Closed on
Sep 21, 2016
Sold by
Apple Kimberly A
Bought by
Apple Christopher J
Current Estimated Value
Home Financials for this Owner
Home Financials are based on the most recent Mortgage that was taken out on this home.
Original Mortgage
$6,441
Outstanding Balance
$5,159
Interest Rate
3.43%
Mortgage Type
Unknown
Estimated Equity
$403,444
Purchase Details
Closed on
Jan 5, 2009
Sold by
Bordac Marcine
Bought by
Copper Properties Llc
Purchase Details
Closed on
Oct 4, 2005
Sold by
Hildebrand Christopher J
Bought by
Bordac Louis and Bordac Marcine
Purchase Details
Closed on
Mar 27, 1998
Sold by
Pak Jang U and Pak Young Y
Bought by
Hildebrand Christopher J
Home Financials for this Owner
Home Financials are based on the most recent Mortgage that was taken out on this home.
Original Mortgage
$68,000
Interest Rate
7.06%
Create a Home Valuation Report for This Property
The Home Valuation Report is an in-depth analysis detailing your home's value as well as a comparison with similar homes in the area
Home Values in the Area
Average Home Value in this Area
Purchase History
| Date | Buyer | Sale Price | Title Company |
|---|---|---|---|
| Apple Christopher J | $654 | None Available | |
| Apple Christopher J | $190,797 | None Available | |
| Copper Properties Llc | $125,280 | Rainier Title Co | |
| Bordac Louis | $181,280 | First American Title Ins | |
| Hildebrand Christopher J | $85,000 | Charter Title Corporation |
Source: Public Records
Mortgage History
| Date | Status | Borrower | Loan Amount |
|---|---|---|---|
| Open | Apple Christopher J | $6,441 | |
| Open | Apple Christopher J | $161,029 | |
| Closed | Apple Christopher J | $161,029 | |
| Previous Owner | Hildebrand Christopher J | $68,000 |
Source: Public Records
Tax History Compared to Growth
Tax History
| Year | Tax Paid | Tax Assessment Tax Assessment Total Assessment is a certain percentage of the fair market value that is determined by local assessors to be the total taxable value of land and additions on the property. | Land | Improvement |
|---|---|---|---|---|
| 2026 | $3,081 | $350,640 | $89,400 | $261,240 |
| 2025 | $3,081 | $350,640 | $89,400 | $261,240 |
| 2024 | $2,987 | $350,640 | $89,400 | $261,240 |
| 2023 | $2,965 | $350,640 | $89,400 | $261,240 |
| 2022 | $2,835 | $280,570 | $71,390 | $209,180 |
| 2021 | $2,616 | $244,680 | $62,080 | $182,600 |
| 2020 | $2,443 | $221,690 | $57,980 | $163,710 |
| 2019 | $2,105 | $209,670 | $54,810 | $154,860 |
| 2018 | $2,202 | $165,580 | $47,570 | $118,010 |
| 2017 | $1,833 | $165,580 | $47,570 | $118,010 |
| 2016 | $1,797 | $148,570 | $45,300 | $103,270 |
| 2015 | $1,737 | $145,630 | $45,300 | $100,330 |
| 2014 | -- | $142,030 | $45,990 | $96,040 |
| 2013 | -- | $142,030 | $45,990 | $96,040 |
Source: Public Records
Map
Nearby Homes
- 7166 E Fillmore St
- 802 California Ave SE
- 7143 SE Grant St
- 7104 SE Kansas St
- 7085 SE Legrand St
- 6521 SE Mile Hill Dr Unit 23
- 1738 Lilypad Place E
- 7847 SE Monte Bella Place
- 5957 E Collins Rd
- 1083 Puget Dr E
- 8009 E Commons Ct
- 7549 E Alki View Ct
- 1381 Alaska Ave SE
- 803 Collins Creek Ln E
- 7230 E Maple St
- 8151 E Seaview Dr
- 7748 E Hemlock St
- 71 Carson Ave SE
- 8185 E Seaview Dr
- 1313 Colchester Dr SE
- 1814 Ricky Ct E
- 1800 Ricky Ct E
- 1820 Ricky Ct E
- 6705 E Polk Ave
- 1809 Ricky Ct E
- 1815 Ricky Ct E
- 1803 Ricky Ct E
- 1821 Ricky Ct E
- 1826 Ricky Ct E
- 6717 E Polk Ave
- 6706 E Polk Ave
- 1827 Ricky Ct E
- 7041 E Firefly Ct
- 1838 Ricky Ct E
- 1 E Polk Ave
- 7033 E Polk Ave
- 7047 E Firefly Ct
- 1832 Ricky Ct E
- 7035 E Firefly Ct
- 1833 Ricky Ct E