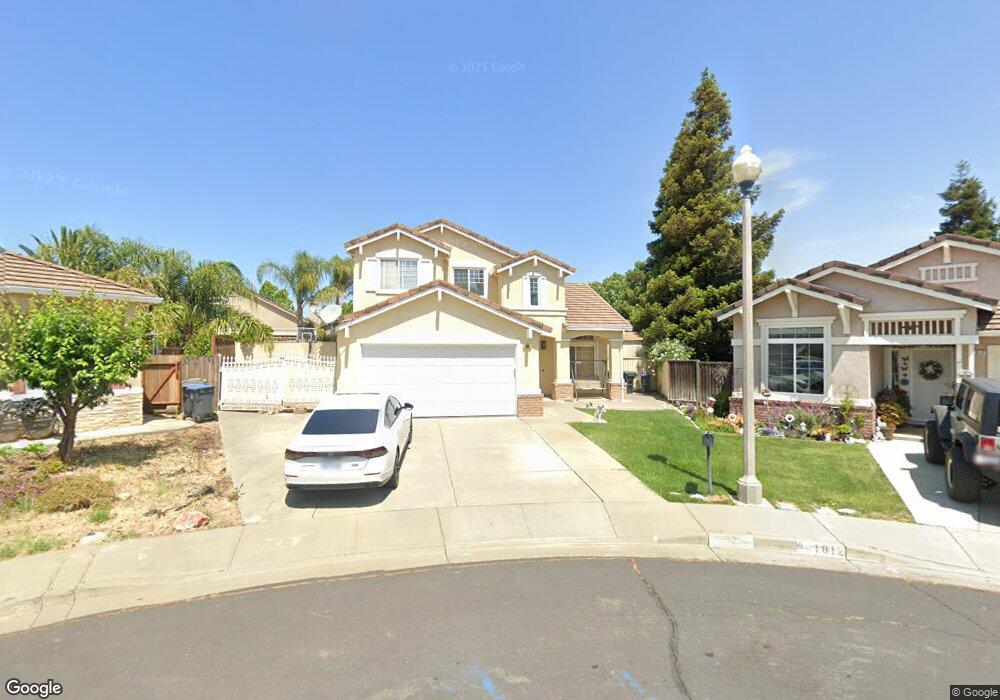
1808 Stillsprings Ct Fairfield, CA 94534
Estimated Value: $544,000 - $692,000
4
Beds
3
Baths
1,816
Sq Ft
$348/Sq Ft
Est. Value
About This Home
This home is located at 1808 Stillsprings Ct, Fairfield, CA 94534 and is currently estimated at $632,755, approximately $348 per square foot. 1808 Stillsprings Ct is a home located in Solano County with nearby schools including Cordelia Hills Elementary School, Green Valley Middle School, and Angelo Rodriguez High School.
Ownership History
Date
Name
Owned For
Owner Type
Purchase Details
Closed on
Aug 21, 2002
Sold by
Urbina Lucian R and Urbina Kara N
Bought by
Machial Avtar and Kaur Manjit
Current Estimated Value
Home Financials for this Owner
Home Financials are based on the most recent Mortgage that was taken out on this home.
Original Mortgage
$265,600
Outstanding Balance
$112,147
Interest Rate
6.52%
Estimated Equity
$520,608
Purchase Details
Closed on
Jul 17, 1998
Sold by
Albert D Seeno Construction Co
Bought by
Urbina Lucian R and Urbina Kara N
Home Financials for this Owner
Home Financials are based on the most recent Mortgage that was taken out on this home.
Original Mortgage
$196,324
Interest Rate
6.9%
Mortgage Type
VA
Create a Home Valuation Report for This Property
The Home Valuation Report is an in-depth analysis detailing your home's value as well as a comparison with similar homes in the area
Home Values in the Area
Average Home Value in this Area
Purchase History
| Date | Buyer | Sale Price | Title Company |
|---|---|---|---|
| Machial Avtar | $332,000 | Frontier Title Company | |
| Urbina Lucian R | $192,500 | Frontier Title Company |
Source: Public Records
Mortgage History
| Date | Status | Borrower | Loan Amount |
|---|---|---|---|
| Open | Machial Avtar | $265,600 | |
| Previous Owner | Urbina Lucian R | $196,324 |
Source: Public Records
Tax History Compared to Growth
Tax History
| Year | Tax Paid | Tax Assessment Tax Assessment Total Assessment is a certain percentage of the fair market value that is determined by local assessors to be the total taxable value of land and additions on the property. | Land | Improvement |
|---|---|---|---|---|
| 2025 | $5,602 | $480,839 | $130,345 | $350,494 |
| 2024 | $5,602 | $471,412 | $127,790 | $343,622 |
| 2023 | $5,417 | $462,170 | $125,285 | $336,885 |
| 2022 | $5,352 | $453,109 | $122,829 | $330,280 |
| 2021 | $5,280 | $444,225 | $120,421 | $323,804 |
| 2020 | $5,368 | $439,671 | $119,187 | $320,484 |
| 2019 | $5,217 | $431,050 | $116,850 | $314,200 |
| 2018 | $5,370 | $422,599 | $114,559 | $308,040 |
| 2017 | $5,301 | $414,313 | $112,313 | $302,000 |
| 2016 | $5,266 | $406,190 | $110,111 | $296,079 |
| 2015 | $4,712 | $378,000 | $91,000 | $287,000 |
| 2014 | $4,610 | $365,000 | $88,000 | $277,000 |
Source: Public Records
Map
Nearby Homes
- 1888 Leaning Oak Dr
- 1756 Fawn Glen Cir
- 1946 Leaning Oak Ct
- 2197 Yellow Rose Cir
- 4538 Paseo Dr
- 4732 Opus Cir
- 824 Crescendo St
- 840 Crescendo St
- 848 Crescendo St
- The Dulcian Plan at Cadence at Gold Hill
- The Adagio Plan at Cadence at Gold Hill
- The Cornet Plan at Cadence at Gold Hill
- The Entrata Plan at Cadence at Gold Hill
- The Bolero Plan at Cadence at Gold Hill
- 4927 Claremont Ct
- 4881 Regency Place
- 828 Stoneridge Cir
- 5062 Brookdale Cir
- 5002 Greenwood Ct
- 680 Silver Lake Dr
- 1807 Stillsprings Ct
- 1807 Stillspring Ct
- 1812 Stillsprings Ct
- 4760 Canyon Hills Dr
- 1811 Stillsprings Ct
- 1816 Stillsprings Ct
- 4748 Canyon Hills Dr
- 4764 Canyon Hills Dr
- 1820 Stillsprings Ct
- 1815 Stillsprings Ct
- 4744 Canyon Hills Dr
- 4768 Canyon Hills Dr
- 1824 Stillsprings Ct
- 1819 Stillsprings Ct
- 4740 Canyon Hills Dr
- 1805 Brook Falls Dr
- 1809 Brook Falls Dr
- 1801 Brook Falls Dr
- 1823 Stillsprings Ct
- 1813 Brook Falls Dr