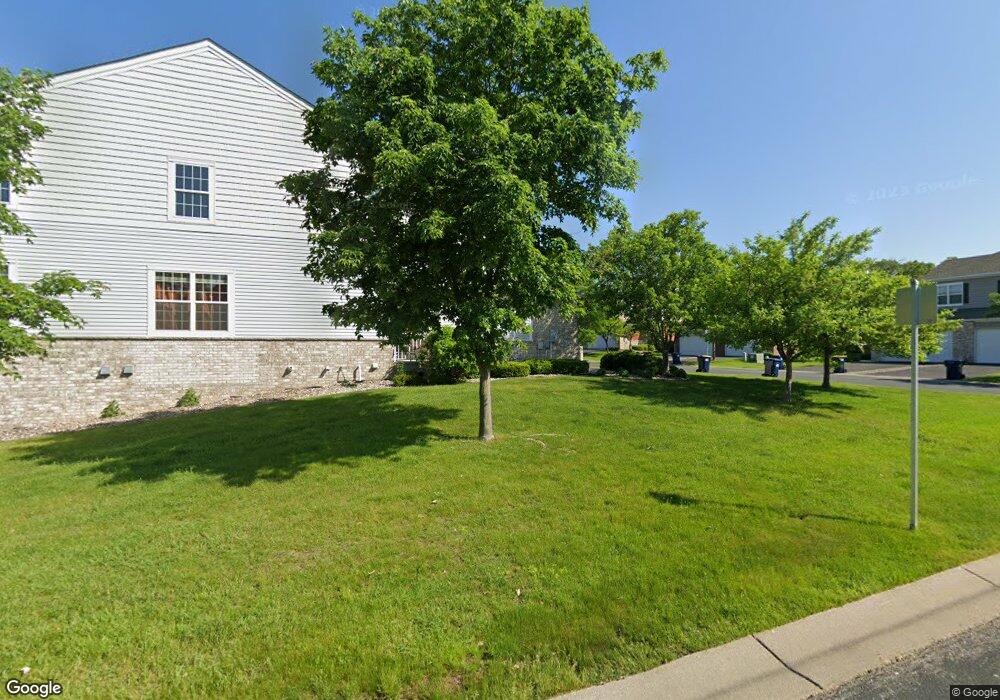
18086 Kindred Ct Lakeville, MN 55044
Estimated Value: $375,000 - $414,000
4
Beds
4
Baths
2,914
Sq Ft
$134/Sq Ft
Est. Value
About This Home
This home is located at 18086 Kindred Ct, Lakeville, MN 55044 and is currently estimated at $389,342, approximately $133 per square foot. 18086 Kindred Ct is a home located in Dakota County with nearby schools including Impact Academy at Orchard Lake Elementary School, Kenwood Trail Middle School, and Lakeville South High School.
Ownership History
Date
Name
Owned For
Owner Type
Purchase Details
Closed on
Aug 19, 2020
Sold by
Jallow Njaga and Jallow Naffie
Bought by
Jallow Njaga and Jallow Naffie J
Current Estimated Value
Purchase Details
Closed on
Aug 30, 2019
Sold by
Beenken Shawna and Beenken Eric J
Bought by
Jallow Njaga
Home Financials for this Owner
Home Financials are based on the most recent Mortgage that was taken out on this home.
Original Mortgage
$299,475
Outstanding Balance
$266,454
Interest Rate
4.4%
Mortgage Type
FHA
Estimated Equity
$122,888
Purchase Details
Closed on
May 19, 2010
Sold by
Hitch Nicole and Hitch Nathaniel J
Bought by
Beenken Eric J
Home Financials for this Owner
Home Financials are based on the most recent Mortgage that was taken out on this home.
Original Mortgage
$203,163
Interest Rate
5.5%
Mortgage Type
FHA
Purchase Details
Closed on
Aug 29, 2007
Sold by
Hovstone Properties Minnesota Llc
Bought by
Hitch Nathaniel J and Knutson Brent A
Create a Home Valuation Report for This Property
The Home Valuation Report is an in-depth analysis detailing your home's value as well as a comparison with similar homes in the area
Home Values in the Area
Average Home Value in this Area
Purchase History
| Date | Buyer | Sale Price | Title Company |
|---|---|---|---|
| Jallow Njaga | -- | None Available | |
| Jallow Njaga | $305,000 | Titlesmart Inc | |
| Beenken Eric J | $205,900 | -- | |
| Hitch Nathaniel J | $259,805 | -- |
Source: Public Records
Mortgage History
| Date | Status | Borrower | Loan Amount |
|---|---|---|---|
| Open | Jallow Njaga | $299,475 | |
| Previous Owner | Beenken Eric J | $203,163 |
Source: Public Records
Tax History Compared to Growth
Tax History
| Year | Tax Paid | Tax Assessment Tax Assessment Total Assessment is a certain percentage of the fair market value that is determined by local assessors to be the total taxable value of land and additions on the property. | Land | Improvement |
|---|---|---|---|---|
| 2024 | $4,792 | $353,500 | $86,200 | $267,300 |
| 2023 | $4,792 | $366,100 | $85,900 | $280,200 |
| 2022 | $4,382 | $342,700 | $85,600 | $257,100 |
| 2021 | $3,454 | $300,600 | $74,400 | $226,200 |
| 2020 | $3,408 | $291,600 | $70,900 | $220,700 |
| 2019 | $3,064 | $274,100 | $67,500 | $206,600 |
| 2018 | $2,970 | $256,700 | $62,500 | $194,200 |
| 2017 | $2,922 | $245,500 | $57,800 | $187,700 |
| 2016 | $2,971 | $239,500 | $55,100 | $184,400 |
| 2015 | $2,829 | $215,858 | $49,270 | $166,588 |
| 2014 | -- | $214,550 | $47,461 | $167,089 |
| 2013 | -- | $180,215 | $40,740 | $139,475 |
Source: Public Records
Map
Nearby Homes
- 18318 Kerrville Trail Unit 610
- 18020 Kenrick Ave
- 17829 Ketchikan Trail
- 17783 Ketchikan Ct
- 17753 Ketchikan Trail
- 11635 177th St W
- 18120 Jurel Cir
- 17854 Lanesboro Ct
- 17655 Empire Trail
- 18411 Lansford Path
- 18720 Kanabec Ct
- 17702 Layton Ct
- 18120 Jarl Ct
- 18581 Joplin Ave
- 18803 Orchard Trail
- 18928 Katrine Ct
- Lot 3 Block 1 Kenrick Ave
- 18282 Justice Way
- 18316 Justice Way
- 18586 Jonesboro Ct
- 18084 Kindred Ct
- 18080 Kindred Ct
- 18094 Kindred Ct
- 18092 18092 Kindred-Court-
- 18078 Kindred Ct Unit 482
- 18078 Kindred Ct
- 18098 Kindred Ct
- 18074 Kindred Ct
- 18100 Kindred Ct
- 18085 Kindred Ct
- 18072 Kindred Ct
- 18087 Kindred Ct
- 18104 Kindred Ct
- 17961 Kincaid Cir
- 18075 Kindred Ct
- 18101 Kindred Ct
- 18068 Kindred Ct
- 18106 Kindred Ct
- 18073 Kindred Ct
- 17957 Kincaid Cir