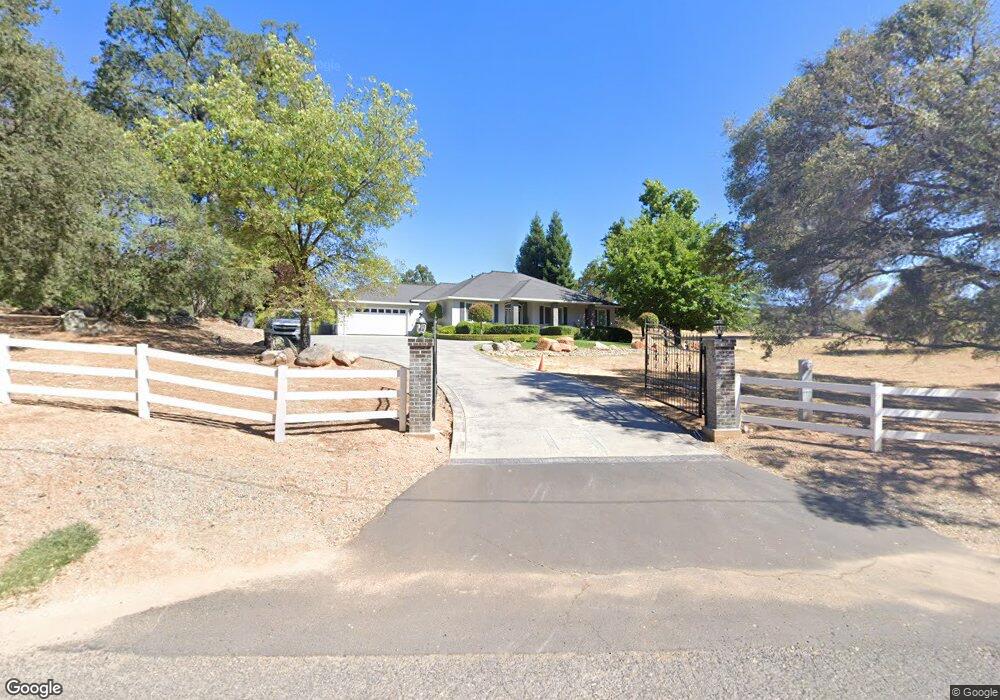
18089 Tinnin Rd Sonora, CA 95370
Estimated Value: $584,000 - $819,000
3
Beds
3
Baths
2,445
Sq Ft
$284/Sq Ft
Est. Value
About This Home
This home is located at 18089 Tinnin Rd, Sonora, CA 95370 and is currently estimated at $694,623, approximately $284 per square foot. 18089 Tinnin Rd is a home located in Tuolumne County with nearby schools including Curtis Creek Elementary School, Dario Cassina High School, and Theodore Bird High School.
Ownership History
Date
Name
Owned For
Owner Type
Purchase Details
Closed on
May 31, 2018
Sold by
Henson Boyd and Henson Mary
Bought by
Henson Boyd and Henson Mary
Current Estimated Value
Purchase Details
Closed on
Apr 3, 2008
Sold by
Henson Mary and Bates Mary
Bought by
Henson Boyd and Henson Mary
Purchase Details
Closed on
Jan 24, 2006
Sold by
Cole Karen S and Land Dennis J
Bought by
Bates Mary
Purchase Details
Closed on
Aug 1, 2005
Sold by
Archibald Frances June and Thon Mary Ruth
Bought by
Cole Karen S and Land Dennis J
Home Financials for this Owner
Home Financials are based on the most recent Mortgage that was taken out on this home.
Original Mortgage
$328,000
Interest Rate
6.12%
Mortgage Type
Fannie Mae Freddie Mac
Purchase Details
Closed on
Aug 10, 2004
Sold by
Green Jack L and Green Susie L
Bought by
Green Susie
Create a Home Valuation Report for This Property
The Home Valuation Report is an in-depth analysis detailing your home's value as well as a comparison with similar homes in the area
Purchase History
| Date | Buyer | Sale Price | Title Company |
|---|---|---|---|
| Henson Boyd | -- | None Available | |
| Henson Boyd | -- | Accommodation | |
| Bates Mary | $503,000 | Yosemite Title Co | |
| Cole Karen S | $410,000 | Yosemite Title Co | |
| Green Susie | -- | -- | |
| Green Susie | -- | -- |
Source: Public Records
Mortgage History
| Date | Status | Borrower | Loan Amount |
|---|---|---|---|
| Previous Owner | Cole Karen S | $328,000 |
Source: Public Records
Tax History
| Year | Tax Paid | Tax Assessment Tax Assessment Total Assessment is a certain percentage of the fair market value that is determined by local assessors to be the total taxable value of land and additions on the property. | Land | Improvement |
|---|---|---|---|---|
| 2025 | $7,630 | $750,170 | $341,642 | $408,528 |
| 2024 | $7,630 | $735,462 | $334,944 | $400,518 |
| 2023 | $7,465 | $721,042 | $328,377 | $392,665 |
| 2022 | $7,315 | $706,905 | $321,939 | $384,966 |
| 2021 | $6,993 | $676,123 | $201,691 | $474,432 |
| 2020 | $6,524 | $631,890 | $188,496 | $443,394 |
| 2019 | $6,397 | $619,500 | $184,800 | $434,700 |
| 2018 | $6,124 | $590,000 | $176,000 | $414,000 |
| 2017 | $5,510 | $536,000 | $160,000 | $376,000 |
| 2016 | $5,018 | $487,509 | $145,544 | $341,965 |
| 2015 | $4,567 | $443,191 | $132,313 | $310,878 |
| 2014 | $4,128 | $402,902 | $120,285 | $282,617 |
Source: Public Records
Map
Nearby Homes
- 18330 Wards Ferry Rd Unit 25
- 18330 Wards Ferry Rd Unit 109
- 18330 Wards Ferry Rd Unit SPC 38
- 18330 Wards Ferry Rd Unit 32
- 0 Old Wards Ferry Rd Unit 41122819
- 14865 Blue Bell Rd W
- 18558 Olov Rd
- 13950 Florence Way
- 13788 Kincaid Flat Rd
- 13893 Tuolumne Rd
- 14192 Tuolumne Rd Unit 67
- 14192 Tuolumne Rd Unit 5
- 18340 Henry D Ct
- 13530 Joshua Way
- 18215 Aarondale Rd
- 19360 Susan Way
- 19510 Hess Ave
- 14610 Mono Way
- 14610 Mono Way Unit 65
- 15895 Morris Rd
- 18140 Tinnin Rd
- 18065 Tinnin Rd
- 18080 Tinnin Rd
- 18016 Wards Ferry Rd
- 18085 Wards Ferry Rd
- 18130 Tinnin Rd
- 18165 Wards Ferry Rd
- 18055 Tinnin Rd
- 18020 Tinnin Rd
- 17990 Wards Ferry Rd
- 18190 Wards Ferry Rd
- 18175 Wards Ferry Rd
- 18045 Tinnin Rd
- 18120 Tinnin Rd
- 17995 Wards Ferry Rd
- 18015 Wards Ferry Rd
- 17970 Wards Ferry Rd
- 17975 Wards Ferry Rd
- 18000 Tinnin Rd
- 17975 Tinnin Rd
Your Personal Tour Guide
Ask me questions while you tour the home.