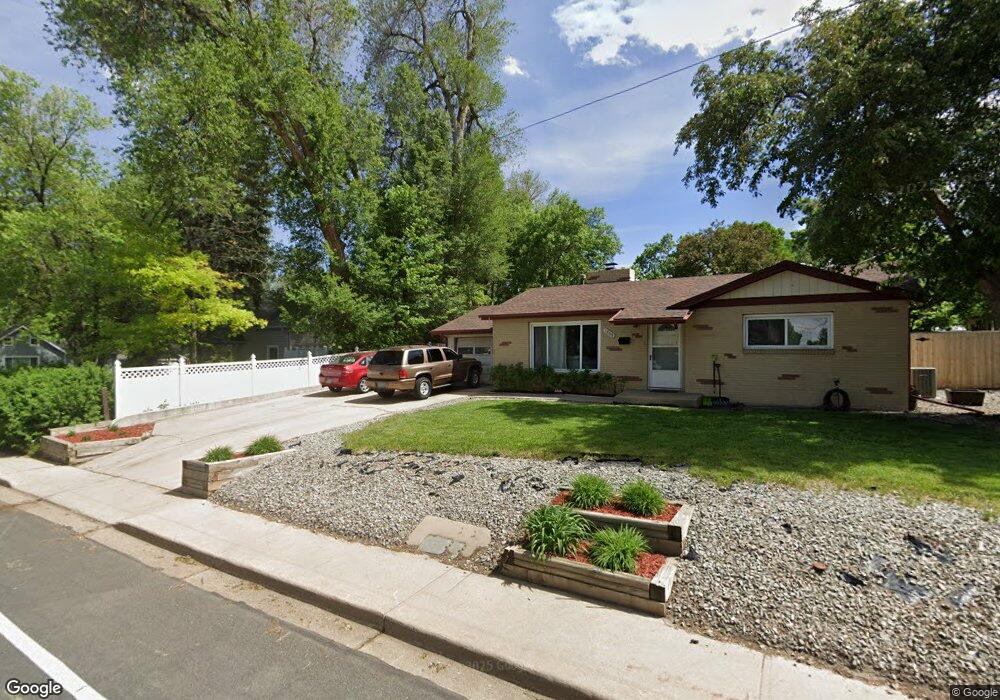
1809 9th Ave Longmont, CO 80501
Sunset NeighborhoodEstimated Value: $403,000 - $449,000
2
Beds
1
Bath
890
Sq Ft
$482/Sq Ft
Est. Value
About This Home
This home is located at 1809 9th Ave, Longmont, CO 80501 and is currently estimated at $428,891, approximately $481 per square foot. 1809 9th Ave is a home located in Boulder County with nearby schools including Central Elementary School, Westview Middle School, and Longmont High School.
Ownership History
Date
Name
Owned For
Owner Type
Purchase Details
Closed on
Oct 18, 1993
Sold by
Vrbas Constance Sue
Bought by
Schluntz Troy James
Current Estimated Value
Home Financials for this Owner
Home Financials are based on the most recent Mortgage that was taken out on this home.
Original Mortgage
$77,900
Interest Rate
6.87%
Purchase Details
Closed on
Feb 17, 1989
Bought by
Schluntz Troy James and Schluntz Casey R
Purchase Details
Closed on
Jan 24, 1985
Bought by
Schluntz Troy James and Schluntz Casey R
Purchase Details
Closed on
Jul 14, 1966
Bought by
Schluntz Troy James and Schluntz Casey R
Create a Home Valuation Report for This Property
The Home Valuation Report is an in-depth analysis detailing your home's value as well as a comparison with similar homes in the area
Home Values in the Area
Average Home Value in this Area
Purchase History
| Date | Buyer | Sale Price | Title Company |
|---|---|---|---|
| Schluntz Troy James | $82,000 | -- | |
| Schluntz Troy James | -- | -- | |
| Schluntz Troy James | $67,900 | -- | |
| Schluntz Troy James | -- | -- |
Source: Public Records
Mortgage History
| Date | Status | Borrower | Loan Amount |
|---|---|---|---|
| Closed | Schluntz Troy James | $77,900 |
Source: Public Records
Tax History
| Year | Tax Paid | Tax Assessment Tax Assessment Total Assessment is a certain percentage of the fair market value that is determined by local assessors to be the total taxable value of land and additions on the property. | Land | Improvement |
|---|---|---|---|---|
| 2025 | $2,400 | $26,719 | $9,481 | $17,238 |
| 2024 | $2,400 | $26,719 | $9,481 | $17,238 |
| 2023 | $2,367 | $25,085 | $10,680 | $18,090 |
| 2022 | $2,189 | $22,122 | $7,881 | $14,241 |
| 2021 | $2,217 | $22,758 | $8,108 | $14,650 |
| 2020 | $1,715 | $17,653 | $7,150 | $10,503 |
| 2019 | $1,688 | $17,653 | $7,150 | $10,503 |
| 2018 | $1,341 | $14,119 | $7,056 | $7,063 |
| 2017 | $1,323 | $15,610 | $7,801 | $7,809 |
| 2016 | $1,214 | $12,704 | $7,880 | $4,824 |
| 2015 | $1,157 | $10,666 | $2,786 | $7,880 |
| 2014 | $996 | $10,666 | $2,786 | $7,880 |
Source: Public Records
Map
Nearby Homes
- 911 Tulip St Unit C
- 6 Sunset Cir
- 1045 Rose St
- 850 Dickens Ct
- 2112 9th Ave
- 1107 Sherri Mar Ct
- 601 Loomis Ct
- 344 Judson St
- 1139 Spencer St
- 927 Hover Ridge Cir
- 1260 Longs Peak Ave
- 402 Sherman St
- 715 Hover St
- 19 Dale Place
- 1217 Lincoln St
- 1206 Aspen St
- 150 Donovan Ct
- 24 Cedar Ct
- 140 Judson St
- 1618 Donovan Place
Your Personal Tour Guide
Ask me questions while you tour the home.