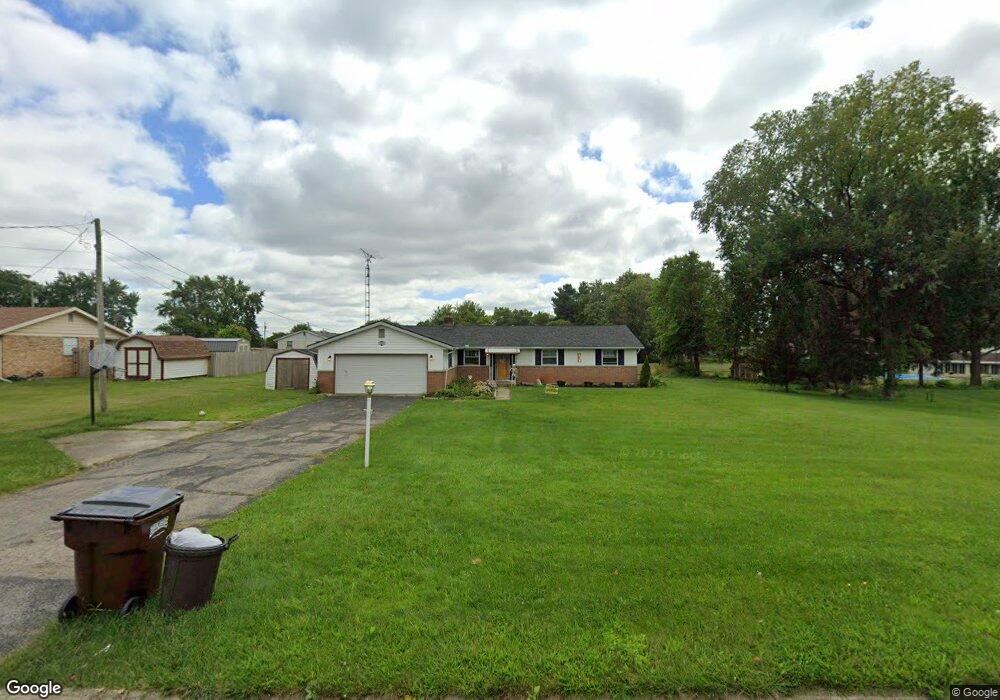
1809 Cheviot Hills Dr Springfield, OH 45505
Estimated Value: $179,000 - $318,000
2
Beds
2
Baths
1,736
Sq Ft
$146/Sq Ft
Est. Value
About This Home
This home is located at 1809 Cheviot Hills Dr, Springfield, OH 45505 and is currently estimated at $253,121, approximately $145 per square foot. 1809 Cheviot Hills Dr is a home located in Clark County with nearby schools including Shawnee Middle School/High School.
Ownership History
Date
Name
Owned For
Owner Type
Purchase Details
Closed on
Jan 9, 2015
Sold by
Pierce Judy and Pierce James F
Bought by
Pierce Judith L
Current Estimated Value
Home Financials for this Owner
Home Financials are based on the most recent Mortgage that was taken out on this home.
Original Mortgage
$84,500
Outstanding Balance
$64,961
Interest Rate
3.94%
Mortgage Type
New Conventional
Estimated Equity
$188,160
Purchase Details
Closed on
Mar 28, 2012
Sold by
Deutsche Bank National Trust Com
Bought by
Pierce Judy and Pierce James F
Home Financials for this Owner
Home Financials are based on the most recent Mortgage that was taken out on this home.
Original Mortgage
$56,550
Interest Rate
3.91%
Mortgage Type
VA
Purchase Details
Closed on
Jan 18, 2012
Sold by
Mccrite Manuela M
Bought by
Deutsche Bank National Trust Company
Purchase Details
Closed on
Dec 2, 1992
Sold by
Waybright Steven Dale and Waybright Valerie J
Bought by
Mccrite Paul and Mccrite Manuela
Purchase Details
Closed on
Sep 19, 1988
Create a Home Valuation Report for This Property
The Home Valuation Report is an in-depth analysis detailing your home's value as well as a comparison with similar homes in the area
Home Values in the Area
Average Home Value in this Area
Purchase History
| Date | Buyer | Sale Price | Title Company |
|---|---|---|---|
| Pierce Judith L | -- | Team Title & Closing Svcs Ll | |
| Pierce Judy | $75,000 | None Available | |
| Deutsche Bank National Trust Company | $56,700 | Attorney | |
| Mccrite Paul | $84,000 | -- | |
| -- | $78,000 | -- |
Source: Public Records
Mortgage History
| Date | Status | Borrower | Loan Amount |
|---|---|---|---|
| Open | Pierce Judith L | $84,500 | |
| Previous Owner | Pierce Judy | $56,550 |
Source: Public Records
Tax History Compared to Growth
Tax History
| Year | Tax Paid | Tax Assessment Tax Assessment Total Assessment is a certain percentage of the fair market value that is determined by local assessors to be the total taxable value of land and additions on the property. | Land | Improvement |
|---|---|---|---|---|
| 2024 | $3,145 | $62,970 | $14,200 | $48,770 |
| 2023 | $3,145 | $62,970 | $14,200 | $48,770 |
| 2022 | $3,119 | $62,970 | $14,200 | $48,770 |
| 2021 | $2,449 | $44,250 | $10,140 | $34,110 |
| 2020 | $2,469 | $44,250 | $10,140 | $34,110 |
| 2019 | $2,508 | $44,250 | $10,140 | $34,110 |
| 2018 | $2,639 | $45,890 | $11,360 | $34,530 |
| 2017 | $2,705 | $45,207 | $11,358 | $33,849 |
| 2016 | $2,447 | $45,207 | $11,358 | $33,849 |
| 2015 | $2,192 | $40,062 | $10,140 | $29,922 |
| 2014 | $2,198 | $40,062 | $10,140 | $29,922 |
| 2013 | $1,917 | $40,062 | $10,140 | $29,922 |
Source: Public Records
Map
Nearby Homes
- 2073 Stowe Dr
- 2216 Hackberry St
- Newcastle Plan at Sycamore Ridge
- Pendleton Plan at Sycamore Ridge
- Bellamy Plan at Sycamore Ridge
- Harmony Plan at Sycamore Ridge
- Holcombe Plan at Sycamore Ridge
- 1320 S Bird Rd
- 2605 Morton Dr
- 2218 Tanager Rd
- 2733 Elmore Dr
- 2751 Share St
- 528 Geron Dr
- 2958 E Possum Rd
- 2753 Van Buren Ave
- 3158 Meadow Wood Dr
- 415 Sherwood Park Dr
- 438 Lawnview Ave
- 801 S Bird Rd
- 1554 S Belmont Ave
- 1833 Perkins Dr
- 1861 Perkins Dr
- 1844 Cheviot Hills Dr
- 1822 Cheviot Hills Dr
- 1856 Cheviot Hills Dr
- 1806 Cheviot Hills Dr
- 1810 Cheviot Hills Dr
- 1911 Perkins Dr
- 1802 Cheviot Hills Dr
- 1900 Cheviot Hills Dr
- 1842 Perkins Dr
- 1812 Cheviot Hills Dr
- 1820 Perkins Dr
- 1850 Perkins Dr
- 1908 Cheviot Hills Dr
- 1820 Cheviot Hills Dr
- 1919 Perkins Dr
- 1804 Perkins Dr
- 1843 Cheviot Hills Dr
- 1908 Perkins Dr