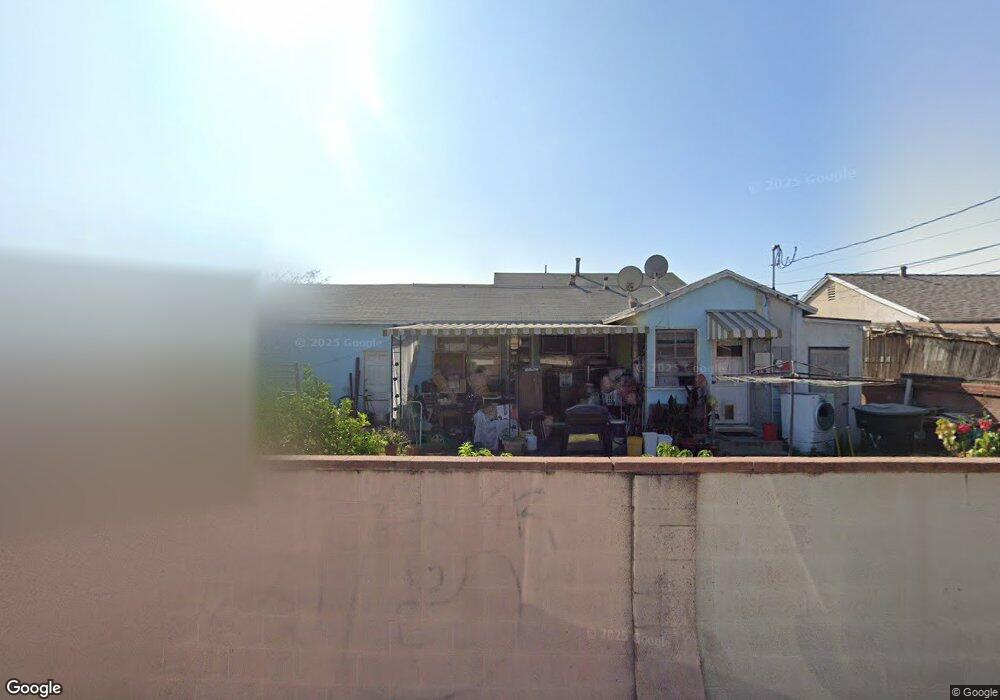
1809 E Elm St Anaheim, CA 92805
North Anaheim NeighborhoodEstimated Value: $785,171 - $831,000
3
Beds
1
Bath
1,069
Sq Ft
$760/Sq Ft
Est. Value
About This Home
This home is located at 1809 E Elm St, Anaheim, CA 92805 and is currently estimated at $812,043, approximately $759 per square foot. 1809 E Elm St is a home located in Orange County with nearby schools including Abraham Lincoln Elementary School, Sycamore Junior High School, and Anaheim High School.
Ownership History
Date
Name
Owned For
Owner Type
Purchase Details
Closed on
Aug 18, 2016
Sold by
Vicencio Jaime A
Bought by
Vicencio Jaime A
Current Estimated Value
Home Financials for this Owner
Home Financials are based on the most recent Mortgage that was taken out on this home.
Original Mortgage
$660,000
Outstanding Balance
$535,587
Interest Rate
4.02%
Mortgage Type
Reverse Mortgage Home Equity Conversion Mortgage
Estimated Equity
$276,456
Purchase Details
Closed on
Jul 26, 2001
Sold by
Wisniewski Ethel P and Sanchez Ethel P
Bought by
Vicencio Jaime A
Purchase Details
Closed on
Oct 3, 1996
Sold by
Mcdaniel Gladys M
Bought by
Vicencio Jaime A and Sanchez Ethel
Home Financials for this Owner
Home Financials are based on the most recent Mortgage that was taken out on this home.
Original Mortgage
$133,334
Interest Rate
8.14%
Mortgage Type
FHA
Create a Home Valuation Report for This Property
The Home Valuation Report is an in-depth analysis detailing your home's value as well as a comparison with similar homes in the area
Home Values in the Area
Average Home Value in this Area
Purchase History
| Date | Buyer | Sale Price | Title Company |
|---|---|---|---|
| Vicencio Jaime A | -- | Placer Title Company | |
| Vicencio Jaime A | -- | -- | |
| Vicencio Jaime A | $135,000 | Benefit Land Title Company |
Source: Public Records
Mortgage History
| Date | Status | Borrower | Loan Amount |
|---|---|---|---|
| Open | Vicencio Jaime A | $660,000 | |
| Previous Owner | Vicencio Jaime A | $133,334 |
Source: Public Records
Tax History
| Year | Tax Paid | Tax Assessment Tax Assessment Total Assessment is a certain percentage of the fair market value that is determined by local assessors to be the total taxable value of land and additions on the property. | Land | Improvement |
|---|---|---|---|---|
| 2025 | $3,328 | $279,792 | $217,339 | $62,453 |
| 2024 | $3,328 | $274,306 | $213,077 | $61,229 |
| 2023 | $3,255 | $268,928 | $208,899 | $60,029 |
| 2022 | $3,210 | $263,655 | $204,803 | $58,852 |
| 2021 | $3,212 | $258,486 | $200,787 | $57,699 |
| 2020 | $3,197 | $255,836 | $198,728 | $57,108 |
| 2019 | $3,104 | $250,820 | $194,831 | $55,989 |
| 2018 | $3,040 | $245,902 | $191,010 | $54,892 |
| 2017 | $2,923 | $241,081 | $187,265 | $53,816 |
| 2016 | $2,912 | $236,354 | $183,593 | $52,761 |
| 2015 | $2,884 | $232,804 | $180,835 | $51,969 |
| 2014 | $2,711 | $228,244 | $177,293 | $50,951 |
Source: Public Records
Map
Nearby Homes
- 539 S Lexington Place
- 2113 E Westport Dr
- 153 N Evelyn Dr
- 400 N Peach Knoll
- 1804 E South St
- 2321 E Puritan Ln
- 206 N Clark Terrace
- 568 S Grove Ave
- Plan 1827 at Sunflower
- 2420 E Agave St Unit 5
- 2420 E Agave St Unit 6
- 2410 E Agave St Unit 3
- 637 N Anna Dr
- 527 N Anna Dr
- 120 S Sunkist St
- 629 S Kinney Way
- 1425 E Vermont Ave
- 1770 E Sandalwood Ave
- 638 N Buttonwood St
- 323 N Rose St Unit 6
Your Personal Tour Guide
Ask me questions while you tour the home.