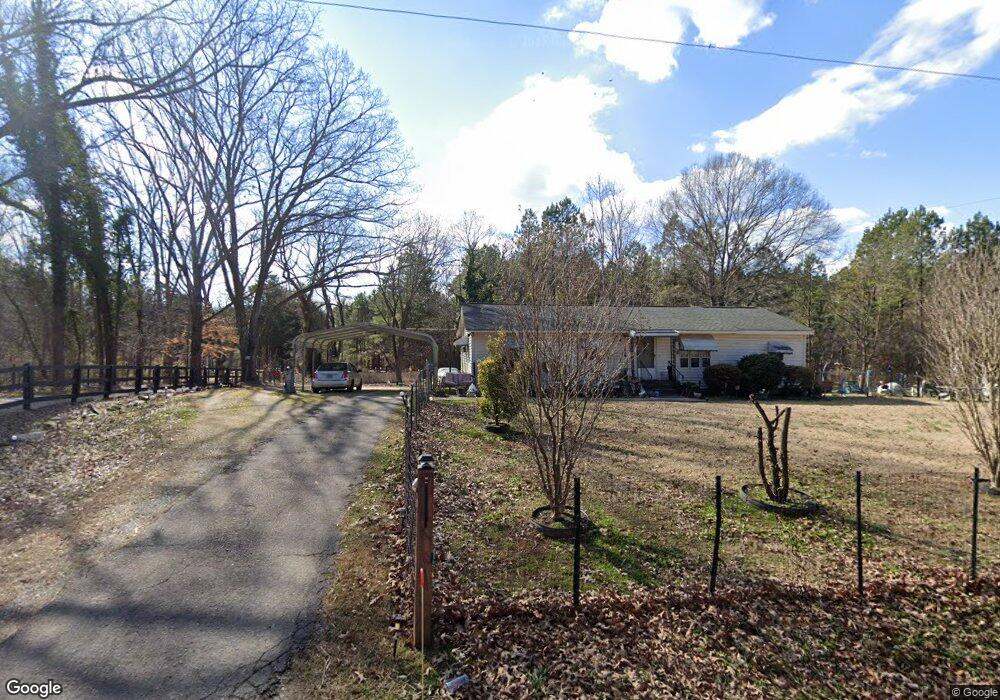
1809 Faulkner Rd Clover, SC 29710
Estimated Value: $598,000 - $764,000
Studio
--
Bath
1,674
Sq Ft
$411/Sq Ft
Est. Value
About This Home
This home is located at 1809 Faulkner Rd, Clover, SC 29710 and is currently estimated at $688,196, approximately $411 per square foot. 1809 Faulkner Rd is a home located in York County with nearby schools including Kinard Elementary School, Clover Middle School, and Clover High School.
Ownership History
Date
Name
Owned For
Owner Type
Purchase Details
Closed on
Feb 25, 2025
Sold by
Jordan Gregory Scott and Jordan Erin M
Bought by
Ferranti Bryan
Current Estimated Value
Purchase Details
Closed on
Feb 23, 2023
Sold by
Fogle Charles C
Bought by
Jordan Gregory Scott and Jordan Erin M
Home Financials for this Owner
Home Financials are based on the most recent Mortgage that was taken out on this home.
Original Mortgage
$528,920
Interest Rate
6.33%
Mortgage Type
New Conventional
Purchase Details
Closed on
Jul 27, 2018
Sold by
Yates Chester A
Bought by
Fogle Charles C
Purchase Details
Closed on
Dec 2, 2013
Sold by
Bolin Timothy G and Bolin Mary Annette
Bought by
Yates Cheste Ra
Purchase Details
Closed on
Oct 17, 2001
Sold by
Bolin Billy G and Bolin Linda A
Bought by
Bolin Timothy G and Bolin Mary Annette
Create a Home Valuation Report for This Property
The Home Valuation Report is an in-depth analysis detailing your home's value as well as a comparison with similar homes in the area
Home Values in the Area
Average Home Value in this Area
Purchase History
We collect this data history from publicly available records. To have your information removed, we recommend requesting removal directly through your county’s website.
| Date | Buyer | Sale Price | Title Company |
|---|---|---|---|
| Ferranti Bryan | $755,000 | None Listed On Document | |
| Ferranti Bryan | $755,000 | None Listed On Document | |
| Jordan Gregory Scott | $679,900 | -- | |
| Fogle Charles C | $45,000 | None Available | |
| Yates Cheste Ra | $2,357 | -- | |
| Bolin Timothy G | $44,000 | -- |
Source: Public Records
Mortgage History
We collect this data history from publicly available records. To have your information removed, we recommend requesting removal directly through your county’s website.
| Date | Status | Borrower | Loan Amount |
|---|---|---|---|
| Previous Owner | Jordan Gregory Scott | $528,920 |
Source: Public Records
Tax History
| Year | Tax Paid | Tax Assessment Tax Assessment Total Assessment is a certain percentage of the fair market value that is determined by local assessors to be the total taxable value of land and additions on the property. | Land | Improvement |
|---|---|---|---|---|
| 2025 | $2,955 | $25,526 | $3,750 | $21,776 |
| 2024 | $2,899 | $24,386 | $3,000 | $21,386 |
| 2023 | $1,329 | $11,983 | $2,200 | $9,783 |
| 2022 | $1,074 | $11,983 | $2,200 | $9,783 |
| 2021 | -- | $11,983 | $2,200 | $9,783 |
| 2020 | $1,056 | $11,983 | $0 | $0 |
| 2019 | $1,161 | $10,000 | $0 | $0 |
| 2018 | $225 | $2,880 | $0 | $0 |
| 2017 | $949 | $2,880 | $0 | $0 |
| 2016 | $925 | $2,880 | $0 | $0 |
| 2014 | $406 | $5,340 | $2,700 | $2,640 |
| 2013 | $406 | $5,448 | $2,688 | $2,760 |
Source: Public Records
Map
Nearby Homes
- 0000 Davis Cir
- 391 Lone Tree Ln
- 884 Beamguard Rd
- 616 Plowshare Way Unit 35
- 348 Triple Ponds Ct Unit 21
- 441 Edmunds Ln
- 310 Triple Ponds Ct
- 1340 Indian Charley Ct
- 309 Triple Ponds Ct
- 254 Triple Ponds Ct
- 559 King Clover Ln
- 941 Capetown Ln
- 413 Misty Law Ln
- 104 Poplar St
- 743 Victory Gallop Ave
- 108 Faulkner St
- 206 Frances St
- 7+/- Acres Forest St
- 1312 Sage Pine Cir Unit 19
- 201 Smith St
- 1795 Faulkner Rd
- 1731 Faulkner Rd
- 1825 Faulkner Rd
- 2050 Roadrunner Rd
- 2044 Roadrunner Rd
- 2038 Roadrunner Rd
- 503 Flying Eagle Dr
- 2056 Roadrunner Rd
- 504 Flying Eagle Dr Unit Lot 1
- 504 Flying Eagle Dr
- 2032 Roadrunner Rd
- 2062 Roadrunner Rd
- 1820 Faulkner Rd
- 1887 Faulkner Rd
- 742 Flamingo Rd
- 2066 Roadrunner Rd
- 2066 Roadrunner Rd Unit 19
- 2045 Roadrunner Rd
- 808 Carolina Wren Dr
- 808 Carolina Wrenn Dr
Your Personal Tour Guide
Ask me questions while you tour the home.