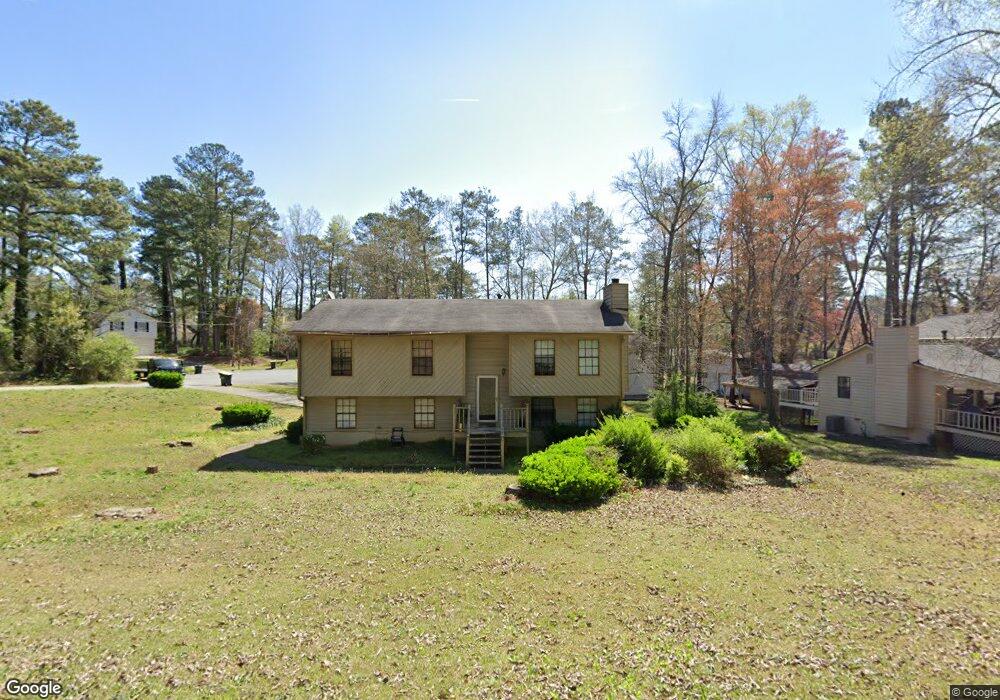
1809 Shadyleaf Ct SW Marietta, GA 30008
Southwestern Marietta NeighborhoodEstimated Value: $284,340 - $375,000
5
Beds
2
Baths
1,178
Sq Ft
$265/Sq Ft
Est. Value
About This Home
This home is located at 1809 Shadyleaf Ct SW, Marietta, GA 30008 and is currently estimated at $312,085, approximately $264 per square foot. 1809 Shadyleaf Ct SW is a home located in Cobb County with nearby schools including Clarkdale Elementary School, Cooper Middle School, and Jubilee Christian Prep Academy.
Ownership History
Date
Name
Owned For
Owner Type
Purchase Details
Closed on
Jun 17, 2011
Sold by
Collins Sean M
Bought by
Handal Dina and Handal Milade
Current Estimated Value
Purchase Details
Closed on
Mar 14, 2007
Sold by
Allison Alejandra
Bought by
Collins Sean M
Home Financials for this Owner
Home Financials are based on the most recent Mortgage that was taken out on this home.
Original Mortgage
$147,000
Interest Rate
9.63%
Mortgage Type
New Conventional
Purchase Details
Closed on
May 2, 2006
Sold by
Mckay Norma
Bought by
Wells Fargo Bk Mn
Purchase Details
Closed on
May 18, 2001
Sold by
Hamilton James R and Hamilton Patricia D
Bought by
Mckay Norman
Home Financials for this Owner
Home Financials are based on the most recent Mortgage that was taken out on this home.
Original Mortgage
$120,000
Interest Rate
10.22%
Mortgage Type
New Conventional
Create a Home Valuation Report for This Property
The Home Valuation Report is an in-depth analysis detailing your home's value as well as a comparison with similar homes in the area
Home Values in the Area
Average Home Value in this Area
Purchase History
| Date | Buyer | Sale Price | Title Company |
|---|---|---|---|
| Handal Dina | $40,000 | -- | |
| Collins Sean M | $147,000 | -- | |
| Wells Fargo Bk Mn | $94,961 | -- | |
| Mckay Norman | $120,000 | -- |
Source: Public Records
Mortgage History
| Date | Status | Borrower | Loan Amount |
|---|---|---|---|
| Previous Owner | Collins Sean M | $147,000 | |
| Previous Owner | Mckay Norman | $120,000 |
Source: Public Records
Tax History Compared to Growth
Tax History
| Year | Tax Paid | Tax Assessment Tax Assessment Total Assessment is a certain percentage of the fair market value that is determined by local assessors to be the total taxable value of land and additions on the property. | Land | Improvement |
|---|---|---|---|---|
| 2025 | $3,307 | $109,768 | $30,000 | $79,768 |
| 2024 | $3,310 | $109,768 | $30,000 | $79,768 |
| 2023 | $2,927 | $97,076 | $20,000 | $77,076 |
| 2022 | $1,995 | $65,720 | $14,000 | $51,720 |
| 2021 | $1,995 | $65,720 | $14,000 | $51,720 |
| 2020 | $1,664 | $54,812 | $14,000 | $40,812 |
| 2019 | $1,664 | $54,812 | $14,000 | $40,812 |
| 2018 | $1,190 | $39,212 | $11,200 | $28,012 |
| 2017 | $1,127 | $39,212 | $11,200 | $28,012 |
| 2016 | $991 | $34,476 | $11,200 | $23,276 |
| 2015 | $1,016 | $34,476 | $11,200 | $23,276 |
| 2014 | $475 | $15,984 | $0 | $0 |
Source: Public Records
Map
Nearby Homes
- 2099 Redbud Ct SW
- 3253 Shadowridge Dr SW
- 3106 Sasanqua Ln SW
- 3000 Fern Valley Dr SW
- 3100 Patriot Square SW
- 3112 Patriot Square SW
- 3145 Fern Valley Dr SW
- 3269 Perch Dr SW
- 3310 Bryan Way SW
- 3159 Fern Valley Dr SW
- 2318 Powder Springs Rd SW
- 1905 Azure Grove Ct
- 2345 Hurt Rd SW
- 1719 Silverchase Dr SW
- 3614 Josh Ct
- 1618 Sparrow Wood Ln SW
- 3530 Argent Way
- 1613 Sparrow Wood Ln SW Unit 3
- 0 Shadyleaf Ct SW Unit 7474931
- 0 Shadyleaf Ct SW
- 3169 Shadyside Rd SW Unit 24
- 3169 Shadyside Rd SW
- 1819 Shadyleaf Ct SW Unit 5
- 3149 Shadyside Rd SW
- 3179 Shadyside Rd SW Unit 5
- 3148 Shadyside Rd SW
- 3170 Shadyside Rd SW
- 1829 Shadyleaf Ct SW
- 1820 Shadyleaf Ct SW
- 3142 Shadyside Rd SW
- 1830 Shadyleaf Ct SW
- 3189 Shadyside Rd SW
- 2047 Pair Rd SW Unit 5
- 2047 Pair Rd SW
- 3140 Shadyside Rd SW
- 2262 Perch Way SW
- 2043 Pair Rd SW
- 2039 Pair Rd SW