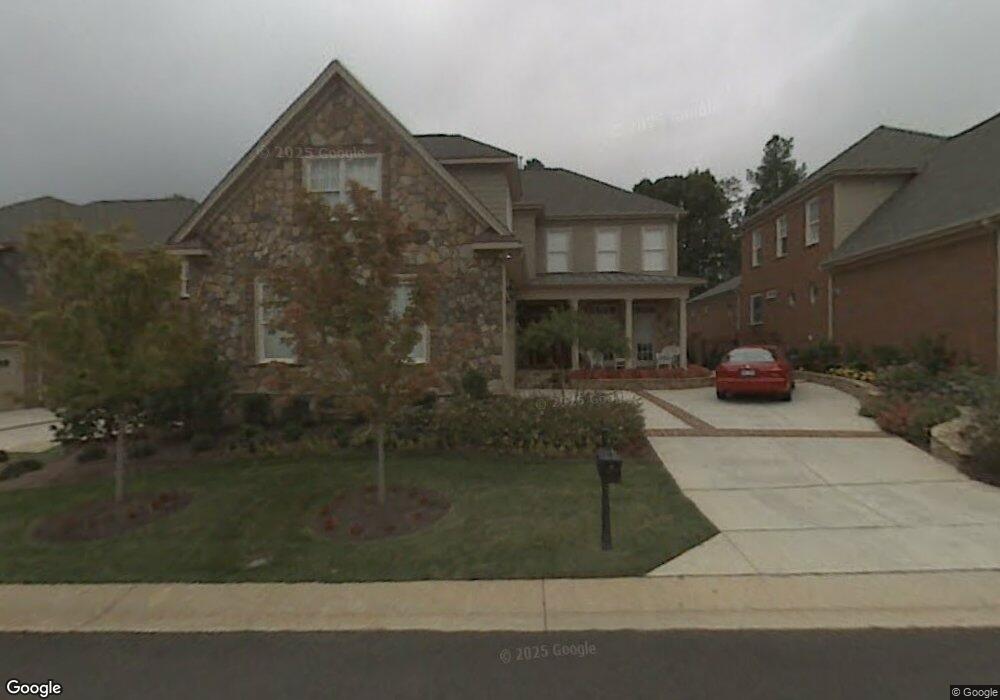
1809 Torrington St Raleigh, NC 27615
Six Forks NeighborhoodEstimated Value: $956,004 - $1,189,000
3
Beds
4
Baths
3,930
Sq Ft
$274/Sq Ft
Est. Value
About This Home
This home is located at 1809 Torrington St, Raleigh, NC 27615 and is currently estimated at $1,076,251, approximately $273 per square foot. 1809 Torrington St is a home located in Wake County with nearby schools including Lead Mine Elementary School, Carroll Middle, and Sanderson High School.
Ownership History
Date
Name
Owned For
Owner Type
Purchase Details
Closed on
Dec 16, 2009
Sold by
Lewis Douglas G and Lewis Judith A
Bought by
Fadool John Phillip and Fadool Sherry Lynn
Current Estimated Value
Home Financials for this Owner
Home Financials are based on the most recent Mortgage that was taken out on this home.
Original Mortgage
$380,000
Outstanding Balance
$249,253
Interest Rate
5.01%
Mortgage Type
New Conventional
Estimated Equity
$826,998
Purchase Details
Closed on
Apr 20, 2006
Sold by
Premiere Homes Ii Inc
Bought by
Lewis Douglas G and Lewis Judith A
Purchase Details
Closed on
Sep 22, 2004
Sold by
Traemoor Village Inc
Bought by
Premiere Homes Ii Inc
Home Financials for this Owner
Home Financials are based on the most recent Mortgage that was taken out on this home.
Original Mortgage
$523,000
Interest Rate
5.78%
Mortgage Type
Construction
Create a Home Valuation Report for This Property
The Home Valuation Report is an in-depth analysis detailing your home's value as well as a comparison with similar homes in the area
Home Values in the Area
Average Home Value in this Area
Purchase History
| Date | Buyer | Sale Price | Title Company |
|---|---|---|---|
| Fadool John Phillip | $540,000 | None Available | |
| Lewis Douglas G | $693,000 | None Available | |
| Premiere Homes Ii Inc | $2,930,000 | -- |
Source: Public Records
Mortgage History
| Date | Status | Borrower | Loan Amount |
|---|---|---|---|
| Open | Fadool John Phillip | $380,000 | |
| Previous Owner | Premiere Homes Ii Inc | $523,000 | |
| Closed | Premiere Homes Ii Inc | $2,390,116 |
Source: Public Records
Tax History Compared to Growth
Tax History
| Year | Tax Paid | Tax Assessment Tax Assessment Total Assessment is a certain percentage of the fair market value that is determined by local assessors to be the total taxable value of land and additions on the property. | Land | Improvement |
|---|---|---|---|---|
| 2025 | $7,469 | $854,120 | $200,000 | $654,120 |
| 2024 | $7,438 | $854,120 | $200,000 | $654,120 |
| 2023 | $6,382 | $583,630 | $120,000 | $463,630 |
| 2022 | $5,929 | $583,630 | $120,000 | $463,630 |
| 2021 | $5,699 | $583,630 | $120,000 | $463,630 |
| 2020 | $5,595 | $583,630 | $120,000 | $463,630 |
| 2019 | $6,986 | $601,062 | $145,000 | $456,062 |
| 2018 | $6,587 | $601,062 | $145,000 | $456,062 |
| 2017 | $6,273 | $601,062 | $145,000 | $456,062 |
| 2016 | $6,144 | $601,062 | $145,000 | $456,062 |
| 2015 | $7,798 | $751,099 | $280,000 | $471,099 |
| 2014 | $7,394 | $751,099 | $280,000 | $471,099 |
Source: Public Records
Map
Nearby Homes
- 8809 Barleymoor Dr
- 8700 Aldersgate Way
- 9021 Armitage Ct
- 1423 Mahonia Ct
- 8337 Greywinds Dr
- 1308 Hillbrow Ln Unit 203
- 8521 Harbor Dr
- 2300 Valley Forge Dr
- 8308 Grey Abbey Place
- 7771 Falcon Rest Cir Unit 7771
- 9005 Pleasant Meadow Dr
- 3008 Eden Harbor Ct
- 10100 Strickland Rd
- 9709 Baileywick Rd
- 717 Misty Isle Place
- 8121 Greys Landing Way
- 1032 Vestavia Woods Dr
- 2204 Middlefield Ct
- 7820 Harbor Dr
- 7922 Footman Way
- 1813 Torrington St
- 1805 Torrington St
- 1817 Torrington St
- 8733 Mariner Dr
- 1821 Torrington St
- 1804 Lodestar Dr
- 1808 Torrington St
- 1812 Torrington St
- 8709 Mariner Dr
- 1804 Torrington St
- 1808 Lodestar Dr
- 1816 Torrington St
- 1825 Torrington St
- 1800 Torrington St
- 8813 Mariner Dr
- 1820 Torrington St
- 1812 Lodestar Dr
- 1824 Torrington St
- 1829 Torrington St
- 8724 Mariner Dr