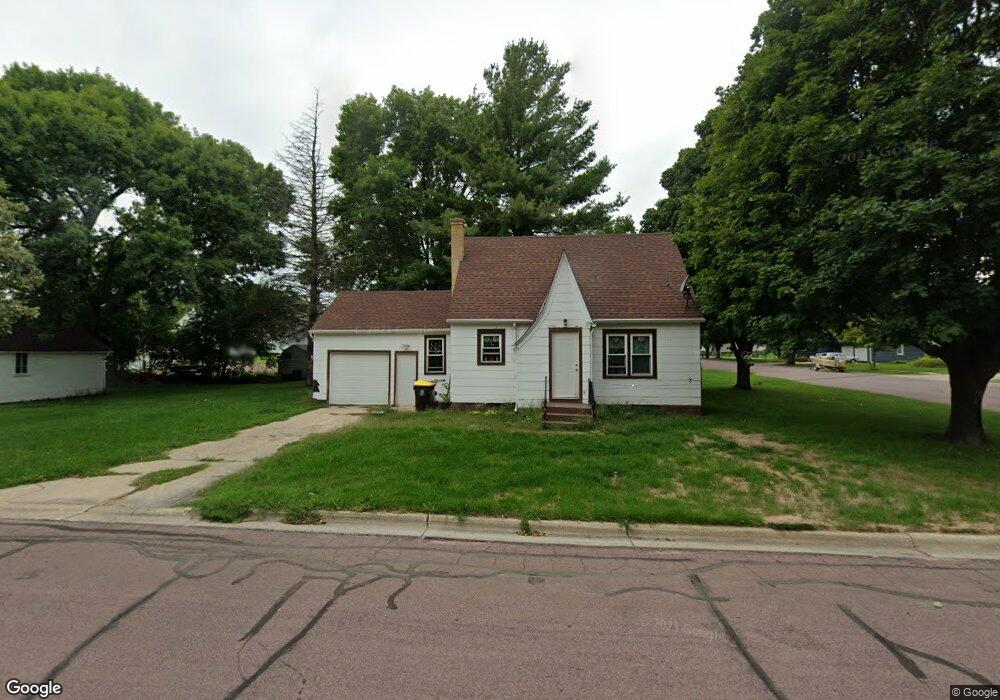
181 2nd Ave NE Unit 181 Second Trimont, MN 56176
Estimated Value: $85,000 - $114,412
2
Beds
2
Baths
1,521
Sq Ft
$67/Sq Ft
Est. Value
About This Home
This home is located at 181 2nd Ave NE Unit 181 Second, Trimont, MN 56176 and is currently estimated at $102,603, approximately $67 per square foot. 181 2nd Ave NE Unit 181 Second is a home located in Martin County with nearby schools including Trimont Elementary School, Sherburn Elementary School, and Welcome Elementary School.
Ownership History
Date
Name
Owned For
Owner Type
Purchase Details
Closed on
Aug 28, 2017
Sold by
Wolner Mark and Wolner Christa
Bought by
Janssen Kevin B
Current Estimated Value
Home Financials for this Owner
Home Financials are based on the most recent Mortgage that was taken out on this home.
Original Mortgage
$37,878
Outstanding Balance
$31,682
Interest Rate
3.96%
Mortgage Type
New Conventional
Estimated Equity
$70,921
Purchase Details
Closed on
Oct 21, 2011
Sold by
Secretary Of Hud Of Washington Dc
Bought by
Wolner Mark
Purchase Details
Closed on
Aug 20, 2010
Sold by
Wells Fargo Bank Na
Bought by
Secretary Of Hud
Purchase Details
Closed on
Mar 30, 2007
Sold by
Cronk Robert W and Cronk Robert Walter
Bought by
Bolen Richard D
Home Financials for this Owner
Home Financials are based on the most recent Mortgage that was taken out on this home.
Original Mortgage
$43,645
Interest Rate
6.37%
Mortgage Type
FHA
Create a Home Valuation Report for This Property
The Home Valuation Report is an in-depth analysis detailing your home's value as well as a comparison with similar homes in the area
Purchase History
| Date | Buyer | Sale Price | Title Company |
|---|---|---|---|
| Janssen Kevin B | $37,500 | None Available | |
| Wolner Mark | -- | None Available | |
| Secretary Of Hud | -- | None Available | |
| Bolen Richard D | $44,351 | None Available |
Source: Public Records
Mortgage History
| Date | Status | Borrower | Loan Amount |
|---|---|---|---|
| Open | Janssen Kevin B | $37,878 | |
| Previous Owner | Bolen Richard D | $43,645 |
Source: Public Records
Tax History
| Year | Tax Paid | Tax Assessment Tax Assessment Total Assessment is a certain percentage of the fair market value that is determined by local assessors to be the total taxable value of land and additions on the property. | Land | Improvement |
|---|---|---|---|---|
| 2025 | $1,006 | $93,200 | $11,900 | $81,300 |
| 2024 | $760 | $82,300 | $9,300 | $73,000 |
| 2023 | $612 | $73,300 | $5,200 | $68,100 |
| 2022 | $618 | $56,300 | $5,200 | $51,100 |
| 2021 | $604 | $43,200 | $5,200 | $38,000 |
| 2020 | $570 | $42,900 | $5,200 | $37,700 |
| 2019 | $554 | $37,400 | $5,200 | $32,200 |
| 2018 | $488 | $31,500 | $4,100 | $27,400 |
| 2017 | $648 | $31,900 | $4,500 | $27,400 |
| 2016 | $628 | $27,700 | $4,100 | $23,600 |
| 2015 | $598 | $28,500 | $4,100 | $24,400 |
| 2013 | $590 | $27,500 | $2,900 | $24,600 |
Source: Public Records
Map
Nearby Homes
- 131 Main St E
- 180 3rd Ave NE
- 341 Main St E
- 310 1st Ave NE
- 151 Chestnut St E
- 51 Chestnut St E
- 31 Chestnut St E Unit 3
- 31 Chestnut St E Unit 5
- 31 Chestnut St E Unit 2
- 31 Chestnut St E Unit 9
- 251 Apple St W
- 1178 210th St
- 801 140th St
- 114 1st Ave
- 213 Broadway Ave
- Xxx Lake Shore Dr
- TBD Lake Shore Dr
- 4 S Fox Lake Dr E
- 4 S Fox Lake Dr W
- 105 S 2nd St
Your Personal Tour Guide
Ask me questions while you tour the home.