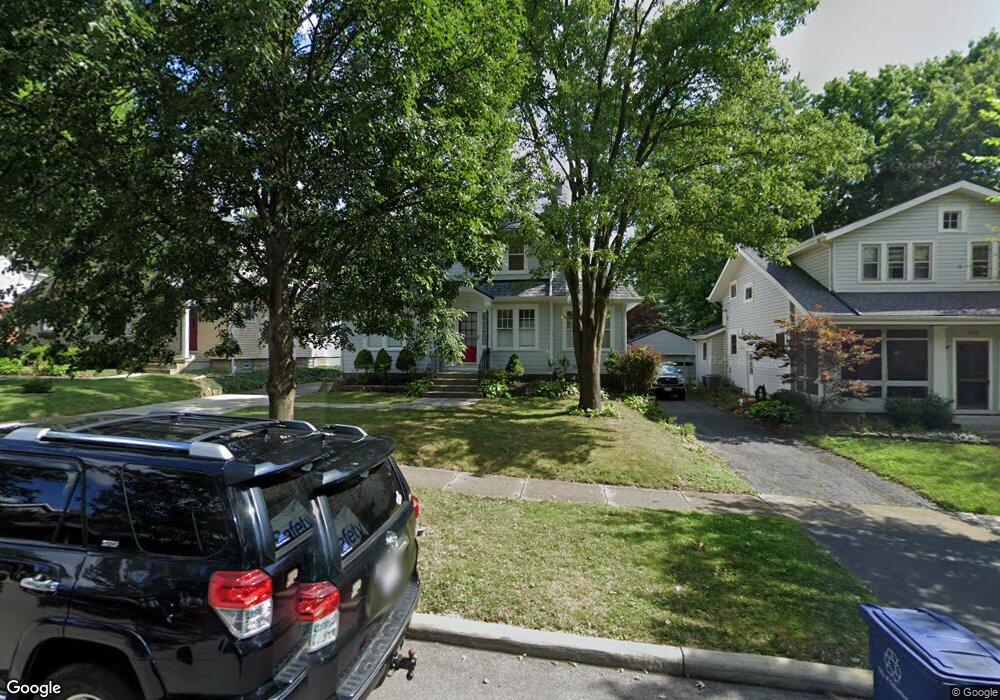
181 Acton Rd Columbus, OH 43214
Clintonville NeighborhoodEstimated Value: $504,204 - $575,000
3
Beds
2
Baths
1,601
Sq Ft
$337/Sq Ft
Est. Value
About This Home
This home is located at 181 Acton Rd, Columbus, OH 43214 and is currently estimated at $538,801, approximately $336 per square foot. 181 Acton Rd is a home located in Franklin County with nearby schools including Indian Springs Elementary School, Dominion Middle School, and Whetstone High School.
Ownership History
Date
Name
Owned For
Owner Type
Purchase Details
Closed on
Sep 3, 2008
Sold by
Cygan Barbara J and Cygan Jeffrey T
Bought by
Tarpoff Karen S
Current Estimated Value
Purchase Details
Closed on
Jul 18, 2005
Sold by
Majewski Eric A and Resatka Patricia A
Bought by
Cygan Barbara J
Home Financials for this Owner
Home Financials are based on the most recent Mortgage that was taken out on this home.
Original Mortgage
$214,200
Interest Rate
5.74%
Mortgage Type
Fannie Mae Freddie Mac
Purchase Details
Closed on
Mar 4, 1999
Sold by
Madden James V
Bought by
Majewski Eric A and Resatka Patricia A
Home Financials for this Owner
Home Financials are based on the most recent Mortgage that was taken out on this home.
Original Mortgage
$149,000
Interest Rate
6.5%
Purchase Details
Closed on
Jan 22, 1986
Bought by
Madden James
Create a Home Valuation Report for This Property
The Home Valuation Report is an in-depth analysis detailing your home's value as well as a comparison with similar homes in the area
Home Values in the Area
Average Home Value in this Area
Purchase History
| Date | Buyer | Sale Price | Title Company |
|---|---|---|---|
| Tarpoff Karen S | $247,000 | Attorney | |
| Cygan Barbara J | $238,000 | Talon Group | |
| Majewski Eric A | $149,000 | Chicago Title | |
| Madden James | $72,500 | -- |
Source: Public Records
Mortgage History
| Date | Status | Borrower | Loan Amount |
|---|---|---|---|
| Previous Owner | Cygan Barbara J | $214,200 | |
| Previous Owner | Majewski Eric A | $149,000 |
Source: Public Records
Tax History Compared to Growth
Tax History
| Year | Tax Paid | Tax Assessment Tax Assessment Total Assessment is a certain percentage of the fair market value that is determined by local assessors to be the total taxable value of land and additions on the property. | Land | Improvement |
|---|---|---|---|---|
| 2024 | $6,069 | $135,240 | $56,070 | $79,170 |
| 2023 | $5,992 | $135,240 | $56,070 | $79,170 |
| 2022 | $7,113 | $137,140 | $36,580 | $100,560 |
| 2021 | $7,125 | $137,140 | $36,580 | $100,560 |
| 2020 | $7,135 | $137,140 | $36,580 | $100,560 |
| 2019 | $6,518 | $107,450 | $28,140 | $79,310 |
| 2018 | $5,807 | $107,450 | $28,140 | $79,310 |
| 2017 | $6,071 | $107,450 | $28,140 | $79,310 |
| 2016 | $5,627 | $84,950 | $31,360 | $53,590 |
| 2015 | $5,108 | $84,950 | $31,360 | $53,590 |
| 2014 | $5,121 | $84,950 | $31,360 | $53,590 |
| 2013 | $2,405 | $80,885 | $29,855 | $51,030 |
Source: Public Records
Map
Nearby Homes
- 128 Blenheim Rd
- 217 Arden Rd
- 374 Acton Rd
- 3726 N High St
- 340 Canyon Dr S
- 541 Northridge Rd
- 197 E Cooke Rd
- 540 Fallis Rd
- 88 W Kenworth Rd
- 685 Yaronia Dr N
- 220 Ceramic Dr
- 36 Brighton Rd
- 148 Deland Ave
- 4000 Indianola Ave
- 49 W Henderson Rd
- 4299 Colerain Ave
- 221 Deland Ave
- 4193 Eastlea Dr
- 419 E North Broadway St
- 111 W Henderson Rd