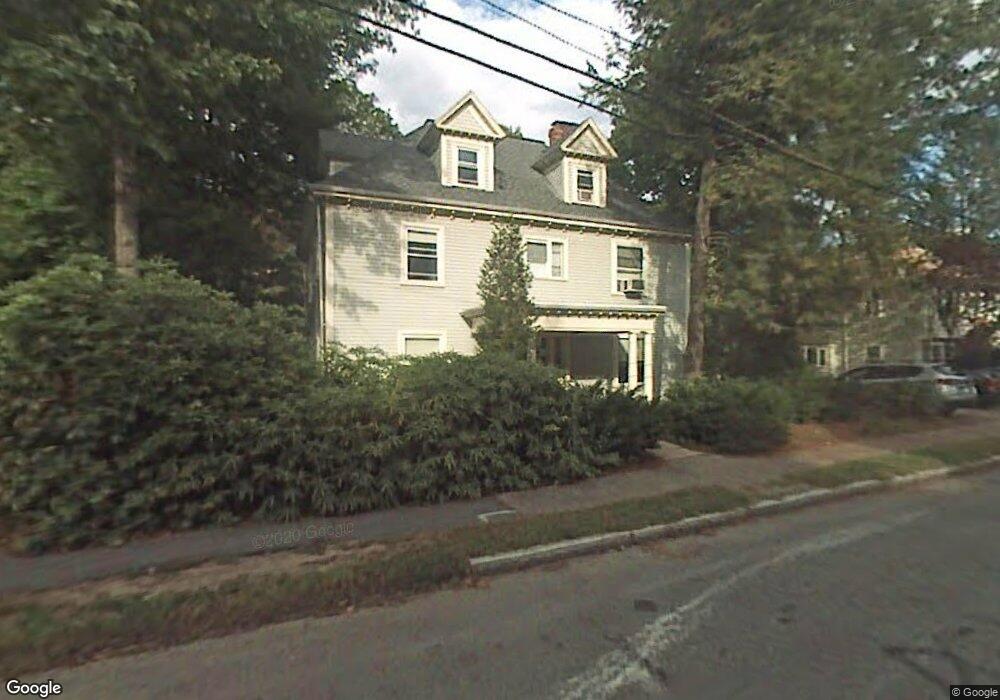
181 Clark Rd Brookline, MA 02445
Brookline Village NeighborhoodEstimated Value: $1,898,000 - $2,674,032
6
Beds
4
Baths
2,894
Sq Ft
$837/Sq Ft
Est. Value
About This Home
This home is located at 181 Clark Rd, Brookline, MA 02445 and is currently estimated at $2,423,008, approximately $837 per square foot. 181 Clark Rd is a home located in Norfolk County with nearby schools including John D. Runkle School, Maimonides School, and Torah Academy.
Ownership History
Date
Name
Owned For
Owner Type
Purchase Details
Closed on
Dec 28, 2006
Sold by
Gottlieb Mark E and Gottlieb Chumi B
Bought by
Rysman Marc and Ephraim Michelle
Current Estimated Value
Home Financials for this Owner
Home Financials are based on the most recent Mortgage that was taken out on this home.
Original Mortgage
$700,000
Interest Rate
6.29%
Mortgage Type
Purchase Money Mortgage
Purchase Details
Closed on
Aug 23, 2000
Sold by
Matvechuk Wasyl M and Matveychuk Mary A
Bought by
Gottlieb Mark E and Gottlieb Chumi B
Home Financials for this Owner
Home Financials are based on the most recent Mortgage that was taken out on this home.
Original Mortgage
$750,000
Interest Rate
8.06%
Mortgage Type
Purchase Money Mortgage
Purchase Details
Closed on
Jan 14, 2000
Sold by
Est Connorton John J and Connorton Ellen V
Bought by
Matveychuk Wasyl M and Matveychuk Mary A
Create a Home Valuation Report for This Property
The Home Valuation Report is an in-depth analysis detailing your home's value as well as a comparison with similar homes in the area
Home Values in the Area
Average Home Value in this Area
Purchase History
| Date | Buyer | Sale Price | Title Company |
|---|---|---|---|
| Rysman Marc | $875,000 | -- | |
| Gottlieb Mark E | $940,000 | -- | |
| Matveychuk Wasyl M | $459,000 | -- |
Source: Public Records
Mortgage History
| Date | Status | Borrower | Loan Amount |
|---|---|---|---|
| Open | Matveychuk Wasyl M | $760,000 | |
| Closed | Rysman Marc | $700,000 | |
| Closed | Rysman Marc | $131,250 | |
| Previous Owner | Matveychuk Wasyl M | $207,000 | |
| Previous Owner | Matveychuk Wasyl M | $750,000 |
Source: Public Records
Tax History Compared to Growth
Tax History
| Year | Tax Paid | Tax Assessment Tax Assessment Total Assessment is a certain percentage of the fair market value that is determined by local assessors to be the total taxable value of land and additions on the property. | Land | Improvement |
|---|---|---|---|---|
| 2025 | $23,123 | $2,342,800 | $1,173,800 | $1,169,000 |
| 2024 | $22,005 | $2,252,300 | $1,128,600 | $1,123,700 |
| 2023 | $18,783 | $1,884,000 | $806,300 | $1,077,700 |
| 2022 | $18,284 | $1,794,300 | $767,900 | $1,026,400 |
| 2021 | $16,908 | $1,725,300 | $738,400 | $986,900 |
| 2020 | $8,063 | $853,200 | $671,200 | $182,000 |
| 2019 | $11,445 | $1,221,500 | $639,300 | $582,200 |
| 2018 | $10,837 | $1,145,600 | $605,100 | $540,500 |
| 2017 | $10,678 | $1,080,800 | $570,800 | $510,000 |
| 2016 | $10,525 | $1,010,100 | $533,500 | $476,600 |
| 2015 | $10,082 | $944,000 | $498,600 | $445,400 |
| 2014 | $10,066 | $883,800 | $458,700 | $425,100 |
Source: Public Records
Map
Nearby Homes
- 255 Tappan St
- 105 Sumner Rd
- 184 Rawson Rd
- 487 Boylston St Unit 3
- 90 Addington Rd Unit 1
- 94 Beaconsfield Rd Unit 201
- 120 Seaver St Unit A103
- 120 Seaver St Unit C-102
- 55 Leicester St
- 15 Colbourne Crescent Unit 2
- 108-116 Winthrop Rd
- 324 Tappan St Unit 1
- 324 Tappan St Unit 2
- 12 Colbourne Crescent Unit 1
- 333 Clark Rd
- 84 Winthrop Rd Unit 1
- 84 Winthrop Rd
- 87 Greenough St Unit 1
- 87 Greenough St Unit 2
- 16 Garrison Rd Unit 7
- 177 Clark Rd Unit Garage
- 177 Clark Rd Unit B2
- 177 Clark Rd
- 175 Clark Rd
- 180 Clark Rd
- 180 Clark Rd Unit A
- 180 Clark Rd
- 180 Clark Rd Unit 180
- 180 Clark Rd Unit 4
- 169 Clark Rd
- 170 Clark Rd
- 184 Clark Rd
- 166 Clark Rd
- 193 Clark Rd
- 188 Clark Rd Unit 2
- 188 Clark Rd Unit 1
- 188 Clark Rd
- 161 Clark Rd
- 160 Clark Rd
- 157 Clark Rd