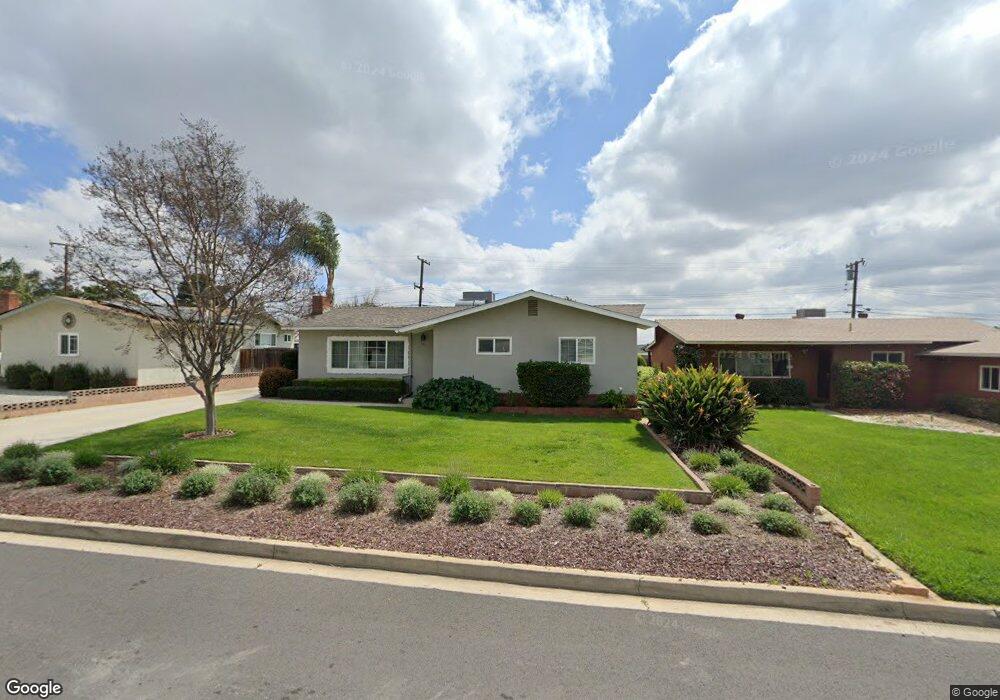
181 Harruby Dr Calimesa, CA 92320
Estimated Value: $439,942 - $484,000
2
Beds
2
Baths
1,160
Sq Ft
$393/Sq Ft
Est. Value
About This Home
This home is located at 181 Harruby Dr, Calimesa, CA 92320 and is currently estimated at $455,736, approximately $392 per square foot. 181 Harruby Dr is a home located in Riverside County with nearby schools including Calimesa Elementary, Mesa View Middle School, and Yucaipa High School.
Ownership History
Date
Name
Owned For
Owner Type
Purchase Details
Closed on
Dec 31, 2012
Sold by
Lozano Marcus M
Bought by
Lozano Tina Marie
Current Estimated Value
Purchase Details
Closed on
Dec 27, 2012
Sold by
Lozano Tina Marie and Westrick Tina Marie
Bought by
Lozano Tina Marie
Purchase Details
Closed on
Mar 9, 2009
Sold by
Stollenberg Pauline
Bought by
Westrick Tina Marie
Home Financials for this Owner
Home Financials are based on the most recent Mortgage that was taken out on this home.
Original Mortgage
$171,830
Outstanding Balance
$108,854
Interest Rate
5.06%
Mortgage Type
FHA
Estimated Equity
$346,882
Purchase Details
Closed on
Mar 24, 2005
Sold by
Elliott Patricia F
Bought by
Elliott Patricia Florence and The Patricia Florence Elliott Trust
Create a Home Valuation Report for This Property
The Home Valuation Report is an in-depth analysis detailing your home's value as well as a comparison with similar homes in the area
Home Values in the Area
Average Home Value in this Area
Purchase History
| Date | Buyer | Sale Price | Title Company |
|---|---|---|---|
| Lozano Tina Marie | -- | Ticor Title Redlands | |
| Lozano Tina Marie | -- | Ticor Title Redlands | |
| Westrick Tina Marie | $175,000 | Lawyers Title Company | |
| Elliott Patricia Florence | -- | -- |
Source: Public Records
Mortgage History
| Date | Status | Borrower | Loan Amount |
|---|---|---|---|
| Open | Westrick Tina Marie | $171,830 |
Source: Public Records
Tax History Compared to Growth
Tax History
| Year | Tax Paid | Tax Assessment Tax Assessment Total Assessment is a certain percentage of the fair market value that is determined by local assessors to be the total taxable value of land and additions on the property. | Land | Improvement |
|---|---|---|---|---|
| 2025 | $2,618 | $225,339 | $83,694 | $141,645 |
| 2023 | $2,618 | $216,591 | $80,445 | $136,146 |
| 2022 | $2,530 | $212,345 | $78,868 | $133,477 |
| 2021 | $2,497 | $208,182 | $77,322 | $130,860 |
| 2020 | $2,494 | $206,049 | $76,530 | $129,519 |
| 2019 | $2,426 | $202,010 | $75,030 | $126,980 |
| 2018 | $2,402 | $198,050 | $73,559 | $124,491 |
| 2017 | $2,349 | $194,167 | $72,117 | $122,050 |
| 2016 | $2,302 | $190,360 | $70,703 | $119,657 |
| 2015 | $2,237 | $187,502 | $69,642 | $117,860 |
| 2014 | $2,190 | $183,831 | $68,279 | $115,552 |
Source: Public Records
Map
Nearby Homes
- 199 Summit View Dr Unit B
- 199 Summit View Dr Unit E
- 147 Myrtlewood Dr
- 244 Country Club Dr
- 1278 2nd Place
- 216 Colonial Dr
- 1286 Pinehurst Dr
- 1156 3rd St
- 1334 Pinehurst Dr
- 0 Slack Place
- 293 Country Club Dr
- 169 Victoria Ln
- 1254 Heritage Dr
- 950 California St Unit 100
- 950 California St Unit 111
- 950 California St Unit 60
- 372 Sandalwood Dr
- 384 Sandalwood Dr
- 832 Hilltop Ct
- 406 Myrtlewood Dr
- 177 Harruby Dr
- 187 Harruby Dr
- 173 Harruby Dr
- 193 Harruby Dr
- 184 Summit View Dr
- 178 Summit View Dr
- 190 Summit View Dr
- 174 Summit View Dr
- 184 Harruby Dr
- 188 Harruby Dr
- 196 Summit View Dr
- 197 Harruby Dr
- 167 Harruby Dr
- 178 Harruby Dr
- 194 Harruby Dr
- 168 Summit View Dr
- 200 Summit View Dr
- 174 Harruby Dr
- 201 Harruby Dr
- 198 Harruby Dr