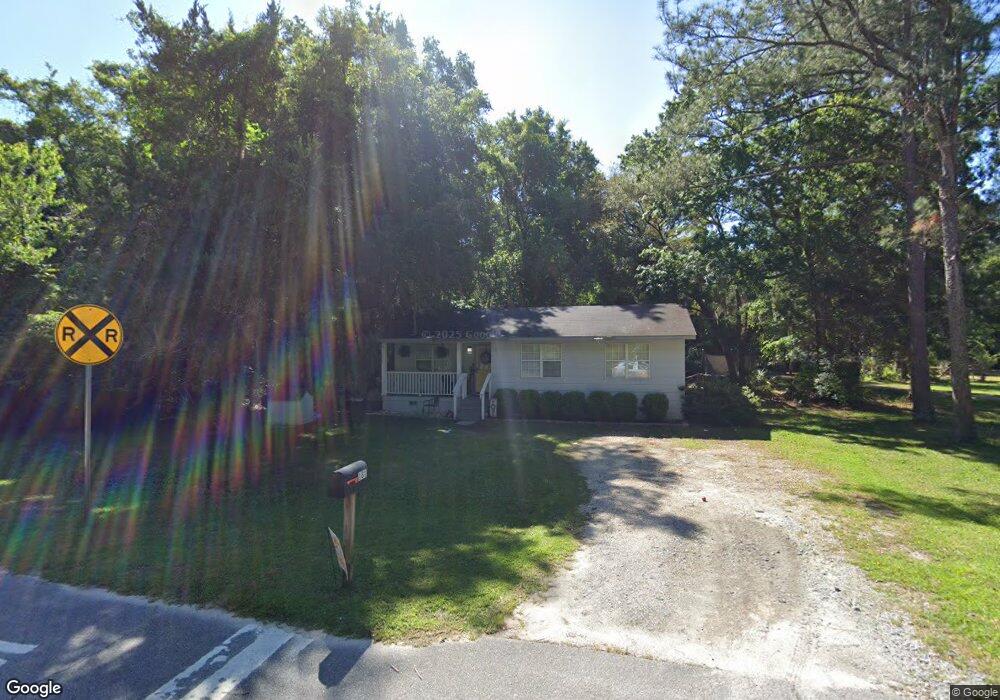
181 Hubbard Rd Saint Marys, GA 31558
Estimated Value: $138,000 - $242,000
3
Beds
2
Baths
850
Sq Ft
$217/Sq Ft
Est. Value
About This Home
This home is located at 181 Hubbard Rd, Saint Marys, GA 31558 and is currently estimated at $184,084, approximately $216 per square foot. 181 Hubbard Rd is a home located in Camden County with nearby schools including Saint Marys Elementary School, Saint Marys Middle School, and Camden County High School.
Ownership History
Date
Name
Owned For
Owner Type
Purchase Details
Closed on
Apr 22, 2025
Sold by
Murphy Jordan Leigh
Bought by
Murphy Skyler Tinsley
Current Estimated Value
Purchase Details
Closed on
Aug 22, 2019
Sold by
Murphy Skyler
Bought by
Murphy Skyler and Ellertsson Jordan
Home Financials for this Owner
Home Financials are based on the most recent Mortgage that was taken out on this home.
Original Mortgage
$85,914
Interest Rate
3.7%
Mortgage Type
FHA
Purchase Details
Closed on
May 19, 2006
Sold by
Not Provided
Bought by
Packard David L
Home Financials for this Owner
Home Financials are based on the most recent Mortgage that was taken out on this home.
Original Mortgage
$70,000
Interest Rate
6.44%
Mortgage Type
New Conventional
Purchase Details
Closed on
Mar 7, 2006
Sold by
Not Provided
Bought by
Packard David L
Purchase Details
Closed on
Feb 9, 2005
Sold by
Addink David
Bought by
Trust 181 Hubbard
Create a Home Valuation Report for This Property
The Home Valuation Report is an in-depth analysis detailing your home's value as well as a comparison with similar homes in the area
Home Values in the Area
Average Home Value in this Area
Purchase History
| Date | Buyer | Sale Price | Title Company |
|---|---|---|---|
| Murphy Skyler Tinsley | -- | -- | |
| Murphy Skyler | -- | -- | |
| Murphy Skyler | $87,500 | -- | |
| Packard David L | $87,500 | -- | |
| Packard David L | -- | -- | |
| Trust 181 Hubbard | -- | -- |
Source: Public Records
Mortgage History
| Date | Status | Borrower | Loan Amount |
|---|---|---|---|
| Previous Owner | Murphy Skyler | $85,914 | |
| Previous Owner | Packard David L | $70,000 |
Source: Public Records
Tax History Compared to Growth
Tax History
| Year | Tax Paid | Tax Assessment Tax Assessment Total Assessment is a certain percentage of the fair market value that is determined by local assessors to be the total taxable value of land and additions on the property. | Land | Improvement |
|---|---|---|---|---|
| 2024 | $1,300 | $43,264 | $2,720 | $40,544 |
| 2023 | $1,315 | $42,389 | $1,845 | $40,544 |
| 2022 | $1,078 | $35,311 | $1,845 | $33,466 |
| 2021 | $1,004 | $31,125 | $1,845 | $29,280 |
| 2020 | $695 | $20,950 | $1,845 | $19,105 |
| 2019 | $701 | $20,950 | $1,845 | $19,105 |
| 2018 | $630 | $20,950 | $1,845 | $19,105 |
| 2017 | $581 | $18,901 | $1,845 | $17,056 |
| 2016 | $560 | $18,280 | $1,845 | $16,435 |
| 2015 | $542 | $18,280 | $1,845 | $16,435 |
| 2014 | $543 | $18,389 | $1,954 | $16,435 |
Source: Public Records
Map
Nearby Homes
- 307 Carolina Ct
- 215 Heron Ct
- 402 Potomac Ct
- 404 Potomac Ct
- 322 Nutgall Dr
- 3852 Georgia 40
- 0 Cedar Hill Dr Unit 10407471
- 275 Heron Ct
- 108 Angler Ln
- 321 Sandhill Rd
- 110 Nutgall Dr
- 313 Chinquapin Dr
- 115 Angler Ln
- 321 Chinquapin Dr
- 307 Chinquapin Dr
- 206 Holm Place
- 401 Victorias Cir
- 200 Angler Ln
- 110 Millers Branch Dr
- V/L 504 Holm Place
- 115 Hubbard Rd
- 183 Rhone Rd E
- 201 Rhone Rd E
- 285 Rhone Rd E
- 207 Tuscarora Ct
- 202 Hubbard Rd
- 58 Hubbard Ln
- 205 Tuscarora Ct
- 208 Tuscarora Ct
- 305 Carolina Ct
- 23 Hubbard Ln
- 203 Tuscarora Ct
- 206 Tuscarora Ct
- 306 Carolina Ct
- 25 Kingfisher Unit C 175
- 25 Kingfisher
- 0 Hubbard Rd Unit Tract 5 8466322
- 0 Hubbard Rd Unit Tract 5
- 14 Hubbard Rd
- 30 Kingfisher Unit 174