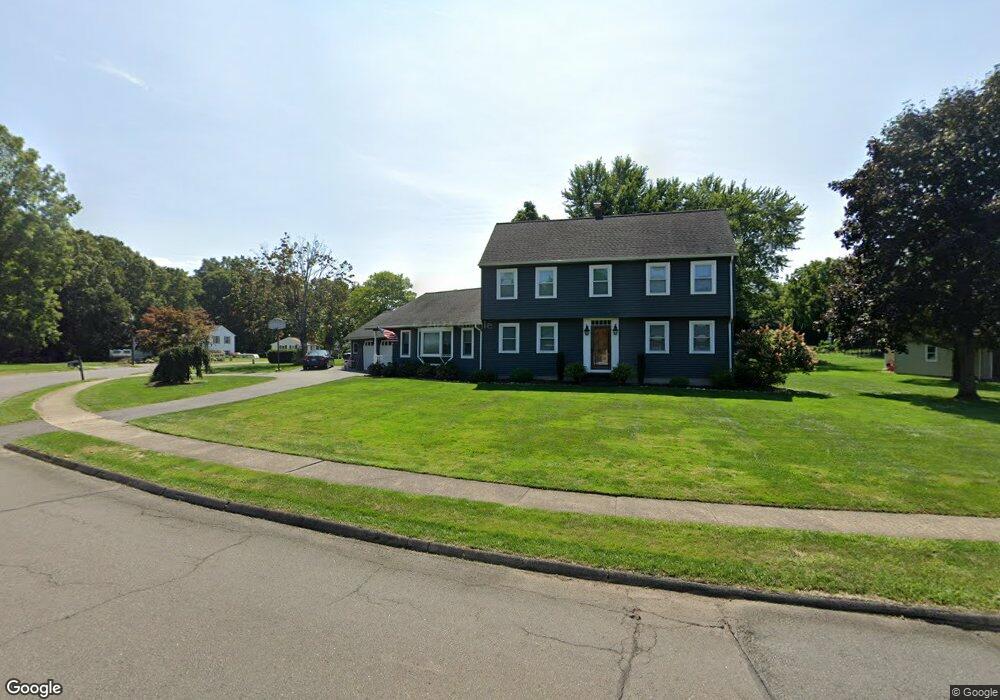
181 Mandel Dr Southington, CT 06489
East Southington NeighborhoodEstimated Value: $481,480 - $557,000
4
Beds
2
Baths
1,973
Sq Ft
$268/Sq Ft
Est. Value
About This Home
This home is located at 181 Mandel Dr, Southington, CT 06489 and is currently estimated at $528,870, approximately $268 per square foot. 181 Mandel Dr is a home located in Hartford County with nearby schools including Reuben E. Thalberg Elementary School, Joseph A. Depaolo Middle School, and Southington High School.
Ownership History
Date
Name
Owned For
Owner Type
Purchase Details
Closed on
Aug 16, 1996
Sold by
Stone Mary
Bought by
Krzesik Michael and Krzesik Carmen
Current Estimated Value
Home Financials for this Owner
Home Financials are based on the most recent Mortgage that was taken out on this home.
Original Mortgage
$165,600
Interest Rate
8.08%
Mortgage Type
Unknown
Purchase Details
Closed on
Oct 28, 1988
Sold by
Griffith Richard
Bought by
Stone Mary
Create a Home Valuation Report for This Property
The Home Valuation Report is an in-depth analysis detailing your home's value as well as a comparison with similar homes in the area
Home Values in the Area
Average Home Value in this Area
Purchase History
| Date | Buyer | Sale Price | Title Company |
|---|---|---|---|
| Krzesik Michael | $185,000 | -- | |
| Stone Mary | $205,000 | -- |
Source: Public Records
Mortgage History
| Date | Status | Borrower | Loan Amount |
|---|---|---|---|
| Closed | Stone Mary | $208,300 | |
| Closed | Stone Mary | $50,000 | |
| Closed | Stone Mary | $172,500 | |
| Closed | Stone Mary | $165,600 |
Source: Public Records
Tax History
| Year | Tax Paid | Tax Assessment Tax Assessment Total Assessment is a certain percentage of the fair market value that is determined by local assessors to be the total taxable value of land and additions on the property. | Land | Improvement |
|---|---|---|---|---|
| 2025 | $7,197 | $216,720 | $62,790 | $153,930 |
| 2024 | $6,814 | $216,720 | $62,790 | $153,930 |
| 2023 | $6,580 | $216,720 | $62,790 | $153,930 |
| 2022 | $6,313 | $216,720 | $62,790 | $153,930 |
| 2021 | $6,291 | $216,720 | $62,790 | $153,930 |
| 2020 | $6,317 | $206,250 | $64,060 | $142,190 |
| 2019 | $6,320 | $206,250 | $64,060 | $142,190 |
| 2018 | $6,284 | $206,160 | $64,060 | $142,100 |
| 2017 | $6,284 | $206,160 | $64,060 | $142,100 |
| 2016 | $6,111 | $206,160 | $64,060 | $142,100 |
| 2015 | $6,138 | $210,650 | $61,020 | $149,630 |
| 2014 | $5,974 | $210,650 | $61,020 | $149,630 |
Source: Public Records
Map
Nearby Homes
- 166 Sun Valley Dr
- 500 Darling St Unit 12J
- 25 Whippoorwill Rd
- 285 Queen St Unit 10I
- 285 Queen St
- 285 Queen St Unit 4F
- 273 Queen St Unit 9C
- 160 Flanders Rd
- 619 Woodruff St
- 775 Woodruff St
- 6 Lakeview Dr
- 184 Hobart St
- 63 Old Cider Mill Rd
- 41 Coach Dr Unit 41
- 60 Marcy Dr
- 1 Coach Dr Unit 1
- 76 Kane St
- 81 Laning St
- 288 Laning St
- 621 Overlook Path
Your Personal Tour Guide
Ask me questions while you tour the home.