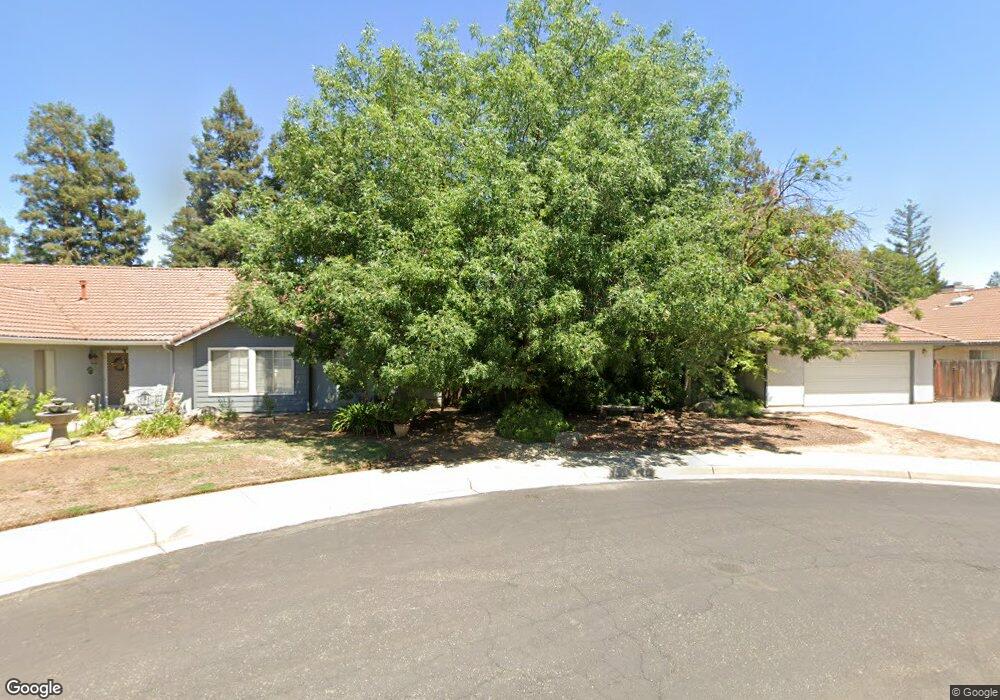
181 N Laurel Ave Clovis, CA 93611
Estimated Value: $398,000 - $473,000
3
Beds
2
Baths
1,505
Sq Ft
$287/Sq Ft
Est. Value
About This Home
This home is located at 181 N Laurel Ave, Clovis, CA 93611 and is currently estimated at $432,141, approximately $287 per square foot. 181 N Laurel Ave is a home located in Fresno County with nearby schools including Cox Elementary School, Clark Intermediate School, and Clovis High School.
Ownership History
Date
Name
Owned For
Owner Type
Purchase Details
Closed on
Dec 21, 2023
Sold by
Millard Jeffrey J
Bought by
Millard Ariel and Millard Jeffrey J
Current Estimated Value
Purchase Details
Closed on
Dec 5, 2001
Sold by
Gentry James R and Gentry James Roland
Bought by
Millard Jeffrey J
Home Financials for this Owner
Home Financials are based on the most recent Mortgage that was taken out on this home.
Original Mortgage
$114,400
Interest Rate
6.73%
Purchase Details
Closed on
Jun 21, 1995
Sold by
Gentry Joy R
Bought by
Gentry James R
Home Financials for this Owner
Home Financials are based on the most recent Mortgage that was taken out on this home.
Original Mortgage
$16,700
Interest Rate
7.88%
Purchase Details
Closed on
Sep 17, 1993
Sold by
Gentry James R and Gentry Joy R
Bought by
Gentry James Roland and Gentry Joy Renee
Home Financials for this Owner
Home Financials are based on the most recent Mortgage that was taken out on this home.
Original Mortgage
$96,000
Interest Rate
7.13%
Create a Home Valuation Report for This Property
The Home Valuation Report is an in-depth analysis detailing your home's value as well as a comparison with similar homes in the area
Home Values in the Area
Average Home Value in this Area
Purchase History
| Date | Buyer | Sale Price | Title Company |
|---|---|---|---|
| Millard Ariel | -- | None Listed On Document | |
| Millard Jeffrey J | $143,000 | Chicago Title Co | |
| Gentry James R | -- | Stewart Title | |
| Gentry James Roland | -- | World Title Company |
Source: Public Records
Mortgage History
| Date | Status | Borrower | Loan Amount |
|---|---|---|---|
| Previous Owner | Millard Jeffrey J | $114,400 | |
| Previous Owner | Gentry James R | $16,700 | |
| Previous Owner | Gentry James Roland | $96,000 |
Source: Public Records
Tax History
| Year | Tax Paid | Tax Assessment Tax Assessment Total Assessment is a certain percentage of the fair market value that is determined by local assessors to be the total taxable value of land and additions on the property. | Land | Improvement |
|---|---|---|---|---|
| 2025 | $2,521 | $211,227 | $70,898 | $140,329 |
| 2023 | $2,473 | $203,027 | $68,146 | $134,881 |
| 2022 | $2,394 | $199,047 | $66,810 | $132,237 |
| 2021 | $2,328 | $195,145 | $65,500 | $129,645 |
| 2020 | $2,319 | $193,145 | $64,829 | $128,316 |
| 2019 | $2,274 | $189,358 | $63,558 | $125,800 |
| 2018 | $2,226 | $185,646 | $62,312 | $123,334 |
| 2017 | $2,175 | $182,007 | $61,091 | $120,916 |
| 2016 | $2,103 | $178,440 | $59,894 | $118,546 |
| 2015 | $2,071 | $175,761 | $58,995 | $116,766 |
| 2014 | $2,033 | $172,319 | $57,840 | $114,479 |
Source: Public Records
Map
Nearby Homes
- 2535 Sierra Ave
- 2578 Warner Ave
- 2325 Sierra Ave
- 2216 Ellery Ave
- 338 N Filbert Ave
- 2231 Escalon Ave
- 335 McKelvy Ave
- 344 McKelvy Ave
- 2051 Los Altos Ave
- 367 N Raphael Ln Unit 367
- 2047 Menlo Ave
- 2051 Sierra Ave
- 2043 Escalon Ave
- 96 Burgan Ave
- 2691 Morris Ave
- 22 N Bliss Ave
- 637 Coventry Ave
- 1855 Vartikian Ave
- 793 Applegate Ave
- 865 McKelvy Ave
- 173 N Laurel Ave
- 193 N Laurel Ave
- 186 N Pecan Ave
- 176 N Pecan Ave
- 196 N Pecan Ave
- 182 N Laurel Ave
- 170 N Laurel Ave
- 194 N Laurel Ave
- 2514 Palo Alto Ave
- 2526 Palo Alto Ave
- 2500 Palo Alto Ave
- 2494 Polson Ave
- 2506 Polson Ave
- 2538 Palo Alto Ave
- 2482 Polson Ave
- 2518 Polson Ave
- 2480 Palo Alto Ave
- 2470 Polson Ave
- 2554 Palo Alto Ave
- 2532 Polson Ave
Your Personal Tour Guide
Ask me questions while you tour the home.