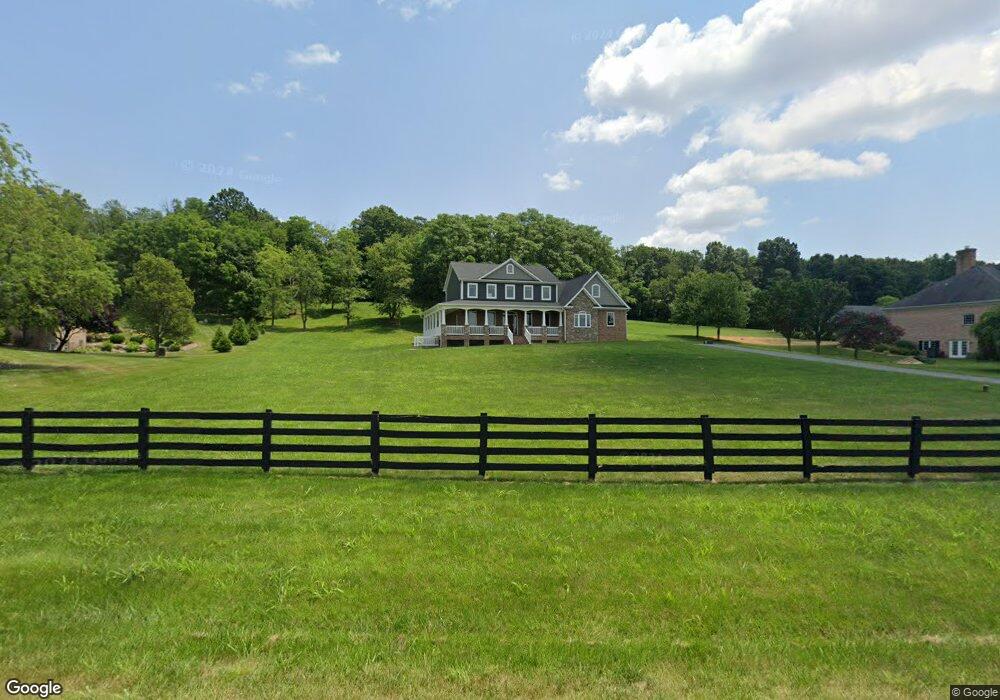
181 Shannon Ct Winchester, VA 22602
Estimated Value: $822,000 - $1,250,000
3
Beds
4
Baths
3,772
Sq Ft
$286/Sq Ft
Est. Value
About This Home
This home is located at 181 Shannon Ct, Winchester, VA 22602 and is currently estimated at $1,078,887, approximately $286 per square foot. 181 Shannon Ct is a home with nearby schools including Orchard View Elementary School, James Wood Middle School, and James Wood High School.
Ownership History
Date
Name
Owned For
Owner Type
Purchase Details
Closed on
Apr 13, 2016
Sold by
Craig David M
Bought by
The Laverne A Cooper Trust U/A Dated Nov
Current Estimated Value
Purchase Details
Closed on
Nov 16, 2015
Sold by
Craig David M and Craig Kim W
Bought by
Craig David M
Purchase Details
Closed on
Oct 31, 2006
Sold by
Mcintyre Iain S
Bought by
Craig David M
Home Financials for this Owner
Home Financials are based on the most recent Mortgage that was taken out on this home.
Original Mortgage
$280,626
Interest Rate
6.33%
Mortgage Type
Unknown
Purchase Details
Closed on
Apr 28, 2004
Sold by
Farrace George P
Bought by
Mcintyre Iain
Home Financials for this Owner
Home Financials are based on the most recent Mortgage that was taken out on this home.
Original Mortgage
$157,200
Interest Rate
5.36%
Mortgage Type
New Conventional
Purchase Details
Closed on
Sep 16, 2002
Sold by
R And T Packing Corp
Bought by
Farrace George P
Create a Home Valuation Report for This Property
The Home Valuation Report is an in-depth analysis detailing your home's value as well as a comparison with similar homes in the area
Home Values in the Area
Average Home Value in this Area
Purchase History
| Date | Buyer | Sale Price | Title Company |
|---|---|---|---|
| The Laverne A Cooper Trust U/A Dated Nov | $187,000 | Attorney | |
| Craig David M | -- | None Available | |
| Craig David M | $305,000 | -- | |
| Mcintyre Iain | $175,000 | -- | |
| Farrace George P | $109,000 | -- |
Source: Public Records
Mortgage History
| Date | Status | Borrower | Loan Amount |
|---|---|---|---|
| Previous Owner | Craig David M | $280,626 | |
| Previous Owner | Mcintyre Iain | $157,200 |
Source: Public Records
Tax History Compared to Growth
Tax History
| Year | Tax Paid | Tax Assessment Tax Assessment Total Assessment is a certain percentage of the fair market value that is determined by local assessors to be the total taxable value of land and additions on the property. | Land | Improvement |
|---|---|---|---|---|
| 2025 | $4,525 | $942,800 | $198,000 | $744,800 |
| 2024 | $2,066 | $810,100 | $177,000 | $633,100 |
| 2023 | $4,132 | $810,100 | $177,000 | $633,100 |
| 2022 | $4,173 | $684,100 | $172,000 | $512,100 |
| 2021 | $4,173 | $684,100 | $172,000 | $512,100 |
| 2020 | $4,257 | $697,800 | $172,000 | $525,800 |
| 2019 | $4,257 | $697,800 | $172,000 | $525,800 |
| 2018 | $939 | $154,000 | $154,000 | $0 |
| 2017 | $924 | $154,000 | $154,000 | $0 |
| 2016 | $714 | $119,000 | $119,000 | $0 |
| 2015 | $348 | $119,000 | $119,000 | $0 |
| 2014 | $348 | $119,000 | $119,000 | $0 |
Source: Public Records
Map
Nearby Homes
- 109 Trellis View Ln
- 111 Trellis View Ln
- 113 Trellis View Ln
- 143 Harvest Ridge Dr
- 147 Harvest Ridge Dr
- 118 Harvest Ridge Dr
- 150 Harvest Ridge Dr
- 2307 Stoneridge Rd
- 2321 Stoneridge Rd
- FREEPORT DUPLEX Plan at Willow Run
- DOVER Plan at Willow Run
- CLIFTON Plan at Willow Run
- BRISTOL Plan at Willow Run
- AZALEA Plan at Willow Run
- 2723 Windwood Dr
- 114 Trellis View Ln
- Lot 3 Cedar Creek Grade
- 922 Meadow Ct
- 107 Lacosta Ct
- 2530 Goldenfield Ln
- LOT 39 Shannon Ct
- 191 Shannon Ct
- 161 Shannon Ct
- 241 Ballygar Dr
- 195 Shannon Ct
- 127 Shannon Ct
- 240 Ballygar Dr
- 0 Wardensville Grade Lot 14a Unit 1006807706
- 8 Conn's Rd E
- 6 Conn's Rd E
- 7 Conn's Rd E
- 1 Conn's Rd E
- 11 Conn's Rd E
- 0 Rt 50 Millwood Pike Unit FV7355133
- 0 Wardensville Grade Lot 14a Unit FV7553193
- 0 Abrams Pointe Blvd Unit FV7570948
- 0 Harold Ct Unit FV7570895
- 0 Harold Ct Unit FV7570946
- 0 Lot C Tomahawk Trail Unit FV7795618
- 0 Cochise Trail Unit FV7991960