Estimated Value: $531,000 - $737,000
4
Beds
3
Baths
2,135
Sq Ft
$309/Sq Ft
Est. Value
About This Home
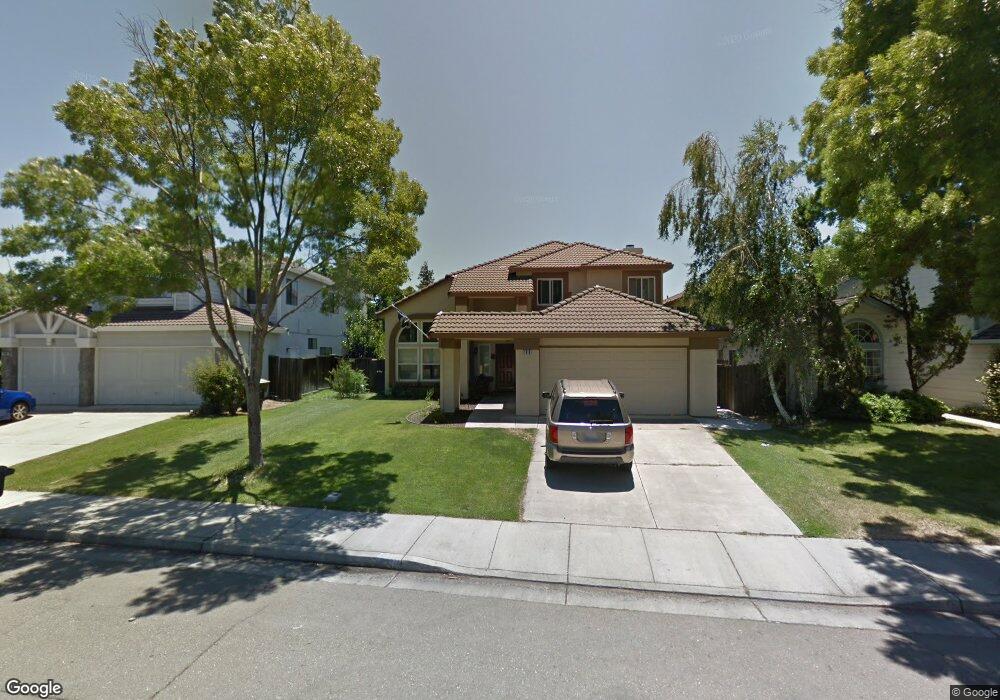
This home is located at 1810 Bayberry Ln, Tracy, CA 95376 and is currently estimated at $658,999, approximately $308 per square foot. 1810 Bayberry Ln is a home located in San Joaquin County with nearby schools including Wanda Hirsch Elementary School, Earle E. Williams Middle School, and John C. Kimball High School.
Ownership History
Date
Name
Owned For
Owner Type
Purchase Details
Closed on
Dec 11, 2024
Sold by
Peralta Andrew P and Hawkins-Peralta Monica
Bought by
Andrew And Monica Peralta Living Trust and Peralta
Current Estimated Value
Purchase Details
Closed on
Nov 8, 2003
Sold by
Hartman Hartman P and Hartman Susan L
Bought by
Peralta Andrew P and Hawkins Peralta Monica
Home Financials for this Owner
Home Financials are based on the most recent Mortgage that was taken out on this home.
Original Mortgage
$295,200
Interest Rate
5.3%
Mortgage Type
Purchase Money Mortgage
Purchase Details
Closed on
Jul 13, 2001
Sold by
Lafferty Michael R and Lafferty Dara L
Bought by
Hartman Hartman P and Hartman Susan L
Home Financials for this Owner
Home Financials are based on the most recent Mortgage that was taken out on this home.
Original Mortgage
$263,900
Interest Rate
7.21%
Create a Home Valuation Report for This Property
The Home Valuation Report is an in-depth analysis detailing your home's value as well as a comparison with similar homes in the area
Home Values in the Area
Average Home Value in this Area
Purchase History
| Date | Buyer | Sale Price | Title Company |
|---|---|---|---|
| Andrew And Monica Peralta Living Trust | -- | None Listed On Document | |
| Andrew And Monica Peralta Living Trust | -- | None Listed On Document | |
| Peralta Andrew P | $369,000 | Alliance Title Co | |
| Hartman Hartman P | $330,000 | First American Title Co |
Source: Public Records
Mortgage History
| Date | Status | Borrower | Loan Amount |
|---|---|---|---|
| Previous Owner | Peralta Andrew P | $295,200 | |
| Previous Owner | Hartman Hartman P | $263,900 | |
| Closed | Peralta Andrew P | $73,800 |
Source: Public Records
Tax History Compared to Growth
Tax History
| Year | Tax Paid | Tax Assessment Tax Assessment Total Assessment is a certain percentage of the fair market value that is determined by local assessors to be the total taxable value of land and additions on the property. | Land | Improvement |
|---|---|---|---|---|
| 2025 | $6,247 | $524,613 | $156,387 | $368,226 |
| 2024 | $5,765 | $514,327 | $153,321 | $361,006 |
| 2023 | $5,673 | $504,243 | $150,315 | $353,928 |
| 2022 | $5,557 | $494,357 | $147,368 | $346,989 |
| 2021 | $5,488 | $484,665 | $144,479 | $340,186 |
| 2020 | $5,451 | $479,696 | $142,998 | $336,698 |
| 2019 | $5,363 | $470,292 | $140,195 | $330,097 |
| 2018 | $5,513 | $461,072 | $137,447 | $323,625 |
| 2017 | $4,932 | $422,000 | $126,000 | $296,000 |
| 2016 | $5,037 | $419,000 | $125,000 | $294,000 |
| 2014 | $4,037 | $339,000 | $101,000 | $238,000 |
Source: Public Records
Map
Nearby Homes
- 265 Quail Meadows Ln
- 1990 Harvest Landing Ct
- 2132 Tennis Ln
- 1600 Smokey Ln
- 1745 Parkside Dr
- 1460 Tennis Ln
- 723 Ann Gabriel Ln
- 2172 Golden Gate Dr
- 2280 Gibralter Ln
- 1590 Doe Trail Ln
- 550 Fawn Glen Dr
- 485 Cape Breton Ln
- 655 Alden Glen Dr
- 19843-Parcel 6 Corral Hollow Rd
- 19843-Parcel 5 Corral Hollow Rd
- 500 Chestnut Ave
- 2352 Gretchen Elizabeth Ct
- 790 Everglades Ln
- 1402 Egret Dr
- 1523 Egret Dr
- 1820 Bayberry Ln
- 1800 Bayberry Ln
- 1809 Mesquite Ct
- 1819 Mesquite Ct
- 1828 Bayberry Ln
- 1801 Mesquite Ct
- 1827 Mesquite Ct
- 1809 Bayberry Ln
- 1819 Bayberry Ln
- 1801 Bayberry Ln
- 1838 Bayberry Ln
- 1827 Bayberry Ln
- 100 Adobe Ln
- 1791 Bayberry Ln
- 120 Adobe Ln
- 1837 Mesquite Ct
- 1837 Bayberry Ln
- 140 Adobe Ln
- 1846 Bayberry Ln
- 1781 Bayberry Ln