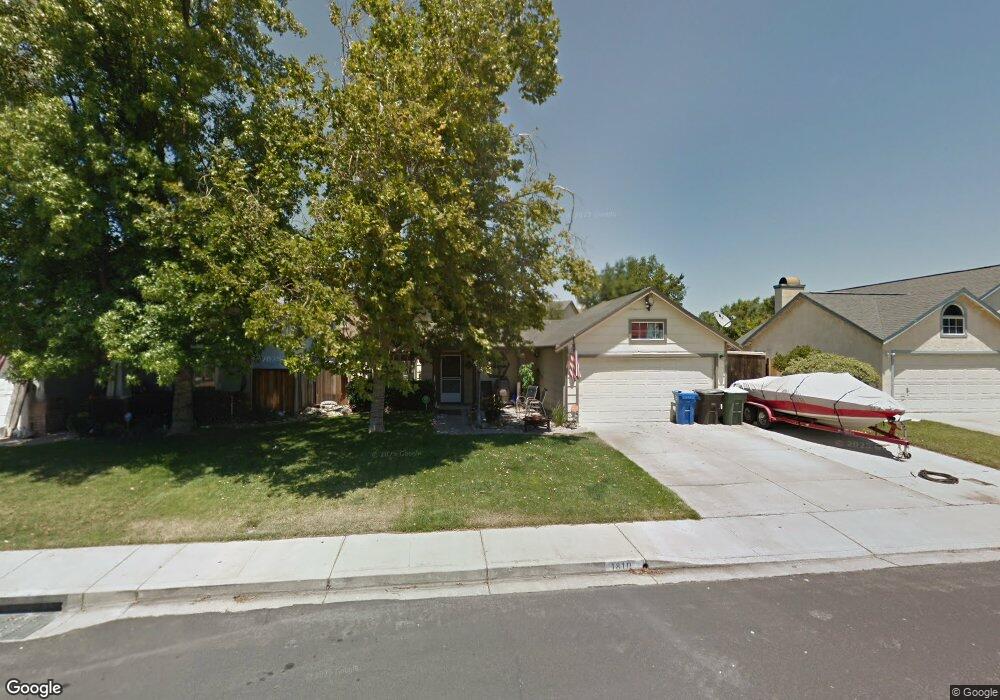
1810 Beringer Way Oakley, CA 94561
Estimated Value: $571,000 - $696,000
3
Beds
2
Baths
1,492
Sq Ft
$406/Sq Ft
Est. Value
About This Home
This home is located at 1810 Beringer Way, Oakley, CA 94561 and is currently estimated at $606,448, approximately $406 per square foot. 1810 Beringer Way is a home located in Contra Costa County with nearby schools including Vintage Parkway Elementary School, Delta Vista Middle School, and Freedom High School.
Ownership History
Date
Name
Owned For
Owner Type
Purchase Details
Closed on
Oct 30, 2021
Sold by
Herron John Wesley and Herron Kristinie Renee
Bought by
Herron John Wesley and Herron Kristine Renee
Current Estimated Value
Purchase Details
Closed on
Dec 3, 2016
Sold by
Herron John
Bought by
Herron John and Herron Ifris
Home Financials for this Owner
Home Financials are based on the most recent Mortgage that was taken out on this home.
Original Mortgage
$297,000
Outstanding Balance
$239,451
Interest Rate
3.47%
Mortgage Type
New Conventional
Estimated Equity
$366,997
Purchase Details
Closed on
Apr 14, 2005
Sold by
Herron John and Herron Donica
Bought by
Herron John
Purchase Details
Closed on
May 19, 2003
Sold by
Galindo Robert R and Galindo Brenda J
Bought by
Herron John and Herron Donica
Home Financials for this Owner
Home Financials are based on the most recent Mortgage that was taken out on this home.
Original Mortgage
$238,400
Interest Rate
5.77%
Mortgage Type
Purchase Money Mortgage
Create a Home Valuation Report for This Property
The Home Valuation Report is an in-depth analysis detailing your home's value as well as a comparison with similar homes in the area
Home Values in the Area
Average Home Value in this Area
Purchase History
| Date | Buyer | Sale Price | Title Company |
|---|---|---|---|
| Herron John Wesley | -- | None Available | |
| Herron V John Wesley V | -- | None Available | |
| Herron John | $151,000 | Tsi Title Ca Inc Cerritos | |
| Herron John | -- | -- | |
| Herron John | $298,000 | Orange Coast Title |
Source: Public Records
Mortgage History
| Date | Status | Borrower | Loan Amount |
|---|---|---|---|
| Open | Herron John | $297,000 | |
| Closed | Herron John | $238,400 |
Source: Public Records
Tax History
| Year | Tax Paid | Tax Assessment Tax Assessment Total Assessment is a certain percentage of the fair market value that is determined by local assessors to be the total taxable value of land and additions on the property. | Land | Improvement |
|---|---|---|---|---|
| 2025 | $6,784 | $432,164 | $166,548 | $265,616 |
| 2024 | $6,619 | $423,691 | $163,283 | $260,408 |
| 2023 | $6,619 | $415,384 | $160,082 | $255,302 |
| 2022 | $6,574 | $407,241 | $156,944 | $250,297 |
| 2021 | $6,487 | $399,257 | $153,867 | $245,390 |
| 2019 | $6,174 | $387,416 | $149,304 | $238,112 |
| 2018 | $6,034 | $379,821 | $146,377 | $233,444 |
| 2017 | $5,954 | $371,000 | $142,977 | $228,023 |
| 2016 | $5,241 | $330,000 | $120,000 | $210,000 |
| 2015 | $4,284 | $316,500 | $121,974 | $194,526 |
| 2014 | $4,164 | $304,000 | $117,157 | $186,843 |
Source: Public Records
Map
Nearby Homes
- 101 Concannon Ct
- 901 Weibel Cir
- 1765 Delta Meadows Way
- 916 Diego Dr
- 633 Country Ln
- 13 Geneseo St
- 30 Otsego St
- 59 Oneida St
- 7 Geneseo St
- 1859 Santa fe St
- 36 Cayuga St
- 64 Oneida St
- 104 Montevino Ct
- 123 Zartop St
- 104 Genoa Way
- 4876 Trenton St
- 0 Main St Unit 41115212
- 5041 Claremont Ct
- 4920 Dawson Dr
- 4855 Edgewood Ct
- 1800 Beringer Way
- 1820 Beringer Way
- 100 Cresta Blanca Ct
- 102 Cresta Blanca Ct
- 1830 Beringer Way
- 1919 Concannon Dr
- 1915 Concannon Dr
- 98 Cresta Blanca Ct
- 1811 Beringer Way
- 1801 Beringer Way
- 1791 Beringer Way
- 1821 Beringer Way
- 1909 Concannon Dr
- 1840 Beringer Way
- 104 Cresta Blanca Ct
- 96 Cresta Blanca Ct
- 41 Monticello Ct
- 1799 Walnut Meadows Dr
- 1850 Beringer Way
- 1789 Walnut Meadows Dr
Your Personal Tour Guide
Ask me questions while you tour the home.