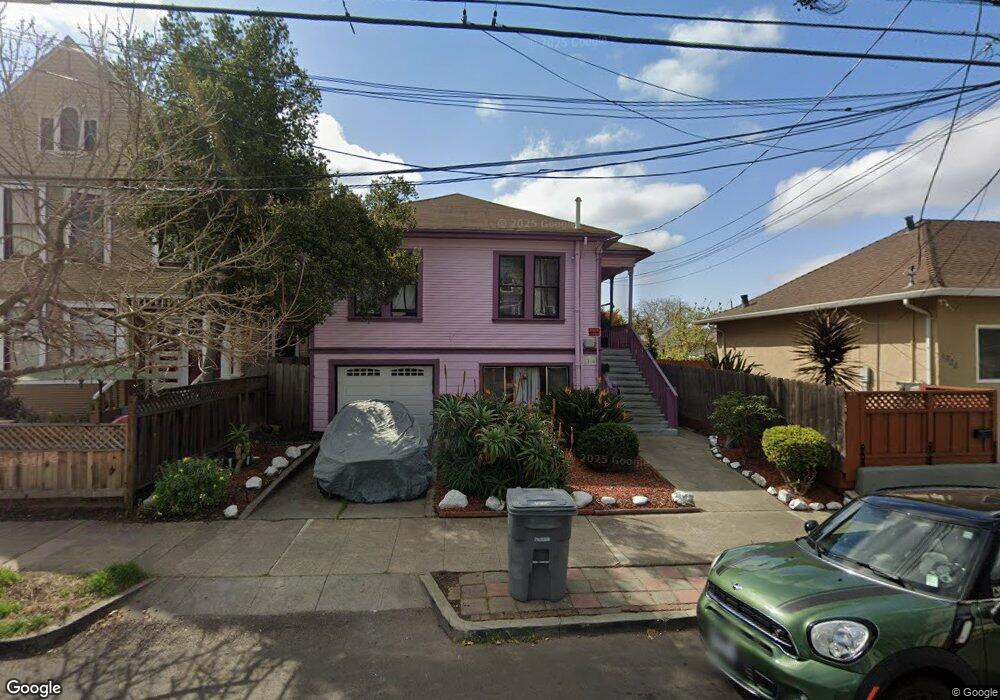
1810 Derby St Berkeley, CA 94703
South Berkeley NeighborhoodEstimated Value: $1,243,000 - $1,549,000
5
Beds
3
Baths
2,699
Sq Ft
$533/Sq Ft
Est. Value
About This Home
This home is located at 1810 Derby St, Berkeley, CA 94703 and is currently estimated at $1,438,667, approximately $533 per square foot. 1810 Derby St is a home located in Alameda County with nearby schools including Malcolm X Elementary School, Emerson Elementary School, and John Muir Elementary School.
Ownership History
Date
Name
Owned For
Owner Type
Purchase Details
Closed on
Mar 26, 2021
Sold by
Anderson Marva
Bought by
Nellie Gammon 2003 Trust and Kambon
Current Estimated Value
Purchase Details
Closed on
Mar 19, 2021
Sold by
Kambon Afi Tiombe
Bought by
Afi Tiombe A Kambon Living Trust and Kambon
Purchase Details
Closed on
Dec 29, 2003
Sold by
Gammon Nellie
Bought by
Gammon Nellie and Nellie Gammon 2003 Trust
Create a Home Valuation Report for This Property
The Home Valuation Report is an in-depth analysis detailing your home's value as well as a comparison with similar homes in the area
Home Values in the Area
Average Home Value in this Area
Purchase History
| Date | Buyer | Sale Price | Title Company |
|---|---|---|---|
| Nellie Gammon 2003 Trust | -- | -- | |
| Afi Tiombe A Kambon Living Trust | -- | None Listed On Document | |
| Muhammad Fatima | -- | None Listed On Document | |
| Gammon Nellie | -- | -- |
Source: Public Records
Tax History
| Year | Tax Paid | Tax Assessment Tax Assessment Total Assessment is a certain percentage of the fair market value that is determined by local assessors to be the total taxable value of land and additions on the property. | Land | Improvement |
|---|---|---|---|---|
| 2025 | $10,187 | $448,969 | $189,800 | $266,169 |
| 2024 | $10,187 | $440,030 | $186,079 | $260,951 |
| 2023 | $9,938 | $431,266 | $182,431 | $255,835 |
| 2022 | $9,678 | $422,673 | $178,854 | $250,819 |
| 2021 | $9,645 | $414,250 | $175,348 | $245,902 |
| 2020 | $8,936 | $416,933 | $173,551 | $243,382 |
| 2019 | $8,374 | $408,759 | $170,148 | $238,611 |
| 2018 | $8,186 | $400,745 | $166,812 | $233,933 |
| 2017 | $4,773 | $137,487 | $55,887 | $81,600 |
| 2016 | $4,434 | $134,792 | $54,792 | $80,000 |
| 2015 | $4,347 | $132,767 | $53,969 | $78,798 |
| 2014 | $4,372 | $130,167 | $52,912 | $77,255 |
Source: Public Records
Map
Nearby Homes
- 2701 Grant St
- 1901 Parker St Unit 3
- 1612 Carleton St
- 1612 Parker St
- 1645 Dwight Way
- 2926 Ellis St
- 2018 Blake St
- 1530 Stuart St
- 1515 Derby St
- 2750 Sacramento St
- 2758 Sacramento St
- 1450 Ward St
- 2774 Sacramento St
- 2782 Sacramento St
- 2790 Sacramento St
- 1535 Julia St
- 1646 Ashby Ave
- 2057 Emerson St
- 2110 Ashby Ave
- 2923 Wheeler St
Your Personal Tour Guide
Ask me questions while you tour the home.