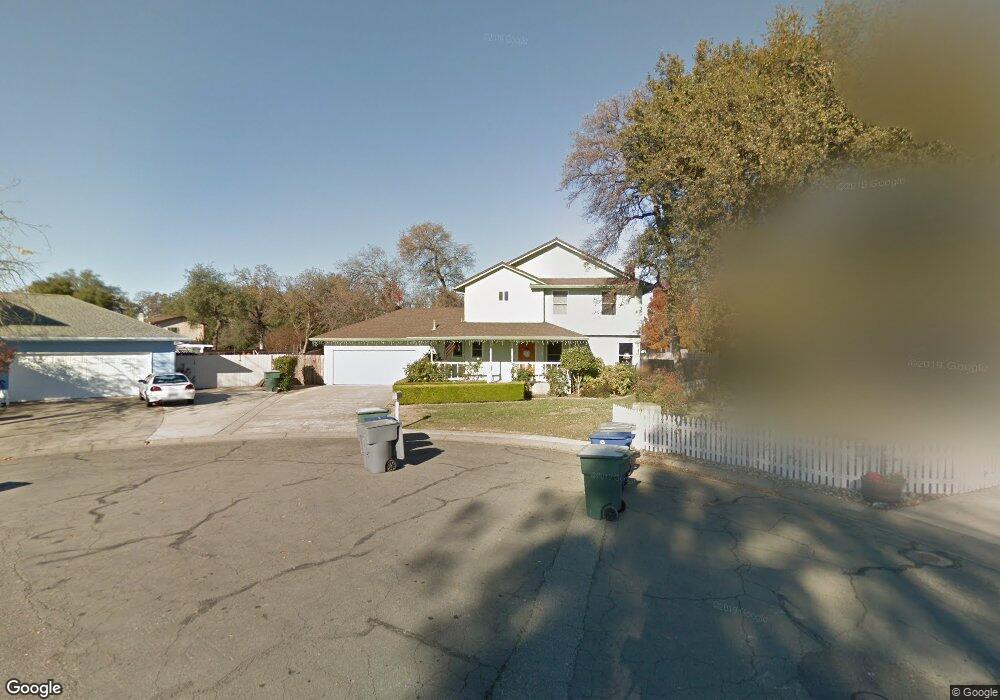
1810 Forest Glen Ct Redding, CA 96002
Mistletoe NeighborhoodEstimated Value: $443,000 - $551,000
3
Beds
3
Baths
2,006
Sq Ft
$256/Sq Ft
Est. Value
About This Home
This home is located at 1810 Forest Glen Ct, Redding, CA 96002 and is currently estimated at $513,215, approximately $255 per square foot. 1810 Forest Glen Ct is a home located in Shasta County with nearby schools including Mistletoe Elementary School, Enterprise High School, and Trinity Lutheran School.
Ownership History
Date
Name
Owned For
Owner Type
Purchase Details
Closed on
Jan 11, 2022
Sold by
Saechao San Nyan W and Saechao Man K
Bought by
Keokhamdy Denise and Saechao Kaota
Current Estimated Value
Home Financials for this Owner
Home Financials are based on the most recent Mortgage that was taken out on this home.
Original Mortgage
$530,000
Interest Rate
3.56%
Mortgage Type
VA
Purchase Details
Closed on
Mar 23, 2018
Sold by
Blume Richard N and Blume Denise L
Bought by
Saechao San Nyan W and Saechao Man K W
Home Financials for this Owner
Home Financials are based on the most recent Mortgage that was taken out on this home.
Original Mortgage
$292,500
Interest Rate
4.32%
Mortgage Type
New Conventional
Purchase Details
Closed on
Aug 15, 2017
Sold by
Blume Denise L and Gelms Denise L
Bought by
Blume Richard N and Blume Denise L
Purchase Details
Closed on
Apr 15, 2005
Sold by
Gelms Kirk J
Bought by
Gelms Denise L
Create a Home Valuation Report for This Property
The Home Valuation Report is an in-depth analysis detailing your home's value as well as a comparison with similar homes in the area
Home Values in the Area
Average Home Value in this Area
Purchase History
| Date | Buyer | Sale Price | Title Company |
|---|---|---|---|
| Keokhamdy Denise | $530,000 | Fidelity National Title | |
| Saechao San Nyan W | $325,000 | Placer Title Co | |
| Blume Richard N | -- | None Available | |
| Gelms Denise L | -- | -- |
Source: Public Records
Mortgage History
| Date | Status | Borrower | Loan Amount |
|---|---|---|---|
| Closed | Keokhamdy Denise | $530,000 | |
| Previous Owner | Saechao San Nyan W | $292,500 |
Source: Public Records
Tax History
| Year | Tax Paid | Tax Assessment Tax Assessment Total Assessment is a certain percentage of the fair market value that is determined by local assessors to be the total taxable value of land and additions on the property. | Land | Improvement |
|---|---|---|---|---|
| 2025 | $5,997 | $562,439 | $84,896 | $477,543 |
| 2024 | $5,913 | $551,412 | $83,232 | $468,180 |
| 2023 | $5,913 | $540,600 | $81,600 | $459,000 |
| 2022 | $3,764 | $348,464 | $53,609 | $294,855 |
| 2021 | $3,635 | $341,632 | $52,558 | $289,074 |
| 2020 | $3,619 | $338,130 | $52,020 | $286,110 |
| 2019 | $3,588 | $331,500 | $51,000 | $280,500 |
| 2018 | $2,492 | $229,574 | $45,258 | $184,316 |
| 2017 | $2,535 | $225,073 | $44,371 | $180,702 |
| 2016 | $2,369 | $220,660 | $43,501 | $177,159 |
| 2015 | $2,349 | $217,346 | $42,848 | $174,498 |
| 2014 | $2,331 | $213,089 | $42,009 | $171,080 |
Source: Public Records
Map
Nearby Homes
- 1750 Hawthorne Ct
- 1018 Pineland Dr
- 1005 Grissom Ct
- 1953 Cameo Ct
- 1285 Lancers Ln
- 1928 Bechelli Ln
- 1968 Bechelli Ln
- 2093 Victor Ave
- 1479 Atajo Ct
- 1088 Burton Dr
- 785 Mallard St
- 2583 Reservoir Ln
- 2631 Alfreda Way
- 1890 Manchester Dr
- 1701 E Cypress Ave
- 1865 Dellwood Dr
- 2820 Alfreda Way
- 953 Oakmont Dr
- 1026 Palisades Ave
- 825 Mission Sierra Ct
- 1822 Forest Glen Ct
- 1807 Forest Glen Ct
- 1837 Pineland Ct
- 1863 Pineland Ct
- 1187 Dusty Ln
- 1844 Forest Glen Ct
- 1821 Forest Glen Ct
- 1201 Dusty Ln
- 1151 Dusty Ln
- 1885 Pineland Ct
- 1811 Pineland Ct
- 1811 Pineland Ct
- 1835 Forest Glen Ct
- 00 Forest Glen Place
- 1145 Dusty Ln
- 1221 Dusty Ln
- 1849 Forest Glen Ct
- 1863 Forest Glen Ct Unit 1
- 1863 Forest Glen Ct
- 1236 Norman Dr
Your Personal Tour Guide
Ask me questions while you tour the home.