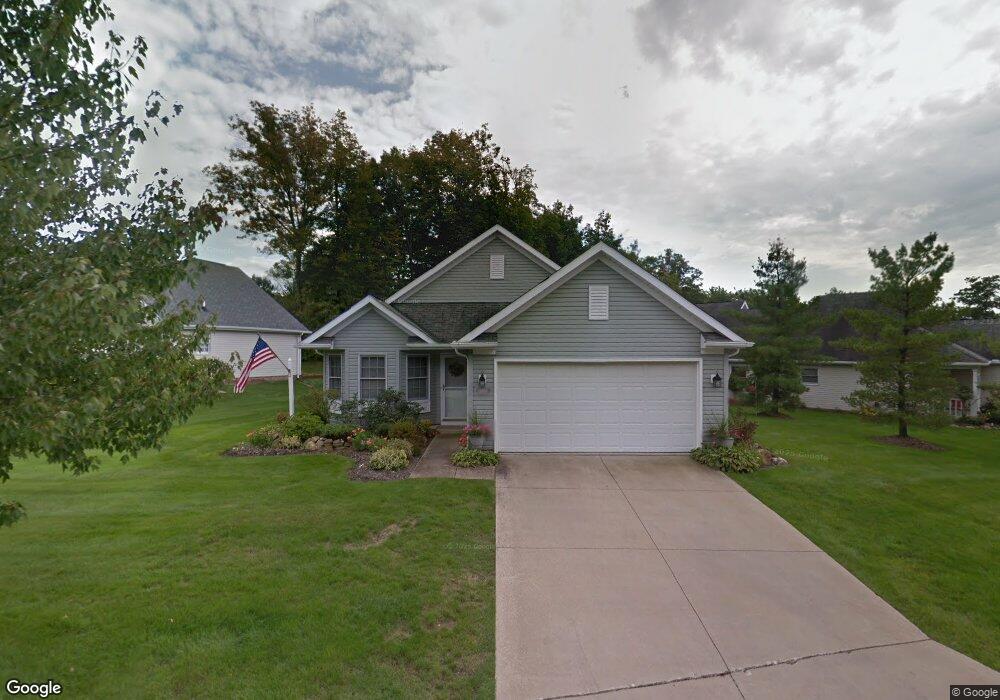
1810 Hampton Run Unit 2 Broadview Heights, OH 44147
Estimated Value: $328,560 - $395,000
2
Beds
2
Baths
1,607
Sq Ft
$221/Sq Ft
Est. Value
About This Home
This home is located at 1810 Hampton Run Unit 2, Broadview Heights, OH 44147 and is currently estimated at $355,390, approximately $221 per square foot. 1810 Hampton Run Unit 2 is a home located in Cuyahoga County with nearby schools including North Royalton Middle School, North Royalton High School, and Assumption Academy.
Ownership History
Date
Name
Owned For
Owner Type
Purchase Details
Closed on
Jul 26, 2018
Sold by
Drown Dolores C
Bought by
Baynes Deborah
Current Estimated Value
Home Financials for this Owner
Home Financials are based on the most recent Mortgage that was taken out on this home.
Original Mortgage
$72,000
Outstanding Balance
$61,193
Interest Rate
3.57%
Mortgage Type
Stand Alone First
Estimated Equity
$294,197
Purchase Details
Closed on
Jul 11, 2002
Sold by
Drown Willard C and Drown Dolores C
Bought by
Drown Willard C and Drown Dolores C
Purchase Details
Closed on
May 9, 2000
Sold by
Tardino Antonia and Diligente Caroline
Bought by
Drown Willard C and Drown Dolores C
Purchase Details
Closed on
Oct 26, 1995
Sold by
Petros Macintosh Builder
Bought by
Finelli Antonina and Diligente Caroline
Create a Home Valuation Report for This Property
The Home Valuation Report is an in-depth analysis detailing your home's value as well as a comparison with similar homes in the area
Home Values in the Area
Average Home Value in this Area
Purchase History
| Date | Buyer | Sale Price | Title Company |
|---|---|---|---|
| Baynes Deborah | $186,250 | Signature Title | |
| Drown Willard C | -- | -- | |
| Drown Willard C | $172,500 | Insignia Title Agency Ltd | |
| Finelli Antonina | $159,900 | -- |
Source: Public Records
Mortgage History
| Date | Status | Borrower | Loan Amount |
|---|---|---|---|
| Open | Baynes Deborah | $72,000 |
Source: Public Records
Tax History Compared to Growth
Tax History
| Year | Tax Paid | Tax Assessment Tax Assessment Total Assessment is a certain percentage of the fair market value that is determined by local assessors to be the total taxable value of land and additions on the property. | Land | Improvement |
|---|---|---|---|---|
| 2024 | $6,682 | $108,535 | $10,850 | $97,685 |
| 2023 | $4,786 | $72,100 | $7,210 | $64,890 |
| 2022 | $4,756 | $72,100 | $7,210 | $64,890 |
| 2021 | $4,828 | $72,100 | $7,210 | $64,890 |
| 2020 | $4,209 | $60,100 | $6,020 | $54,080 |
| 2019 | $4,091 | $171,700 | $17,200 | $154,500 |
| 2018 | $3,421 | $60,100 | $6,020 | $54,080 |
| 2017 | $3,477 | $57,790 | $5,780 | $52,010 |
| 2016 | $3,311 | $57,790 | $5,780 | $52,010 |
| 2015 | $3,154 | $57,790 | $5,780 | $52,010 |
| 2014 | $3,154 | $56,110 | $5,600 | $50,510 |
Source: Public Records
Map
Nearby Homes
- 2025 Foxglove Ln Unit 1703
- 1340 Old Mill Path Unit 613
- 1485 Golden Ln
- 1435 Fireside Trail
- 2839 Gates Ct
- 1205 Mallard Pond Cir
- 1375 Golden Ln
- 10356 Broadview Rd
- 10305 Broadview Rd
- 1038 Orchard Ln
- 71 Heartland Cir
- 421 Bordeaux Blvd
- 456 Bordeaux Blvd
- 425 Bordeaux Blvd
- 558 Lenox Ct
- 265 Lexington Cir
- 127 Walden Ridge Dr
- 4354 Brookhaven Dr
- 18591 Glenbrook
- 3500 Wiltshire Rd
- 1800 Hampton Run
- 1820 Hampton Run Unit 3
- 1830 Hampton Run
- 1845 Hampton Run
- 1835 Hampton Run Unit 29
- 1825 Hampton Run
- 1855 Hampton Run
- 1865 Hampton Run
- 1865 Hampton Run Unit 26
- 1815 Hampton Run Unit 31
- 1840 Hampton Run
- 1875 Hampton Run
- 1705 Jonathans Trace
- 1805 Hampton Run Unit 32
- 1765 Cortland Ln Unit 1542
- 1885 Hampton Run
- 1755 Cortland Ln Unit 1541
- 1745 Cortland Ln
- 1735 Cortland Ln
- 1775 Cortland Ln