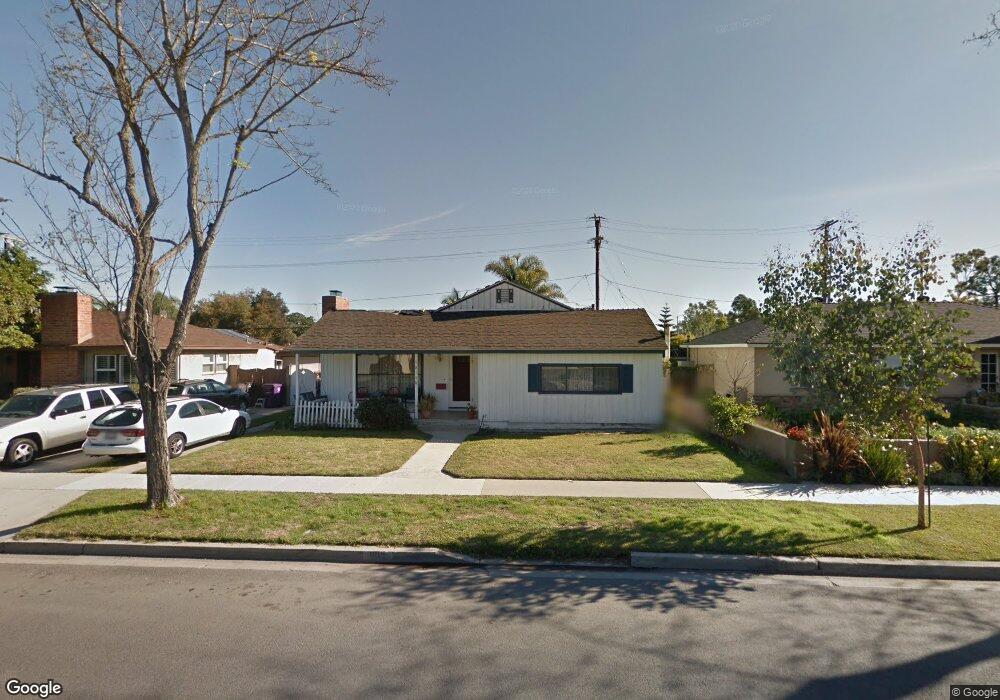
1810 Mcnab Ave Long Beach, CA 90815
Los Altos South NeighborhoodEstimated Value: $992,000 - $1,324,000
3
Beds
2
Baths
1,776
Sq Ft
$659/Sq Ft
Est. Value
About This Home
This home is located at 1810 Mcnab Ave, Long Beach, CA 90815 and is currently estimated at $1,170,930, approximately $659 per square foot. 1810 Mcnab Ave is a home located in Los Angeles County with nearby schools including Minnie Gant Elementary School, Stanford Middle School, and Woodrow Wilson High School.
Ownership History
Date
Name
Owned For
Owner Type
Purchase Details
Closed on
Jan 16, 2003
Sold by
Adams Richard C
Bought by
Adams Richard C
Current Estimated Value
Home Financials for this Owner
Home Financials are based on the most recent Mortgage that was taken out on this home.
Original Mortgage
$300,000
Outstanding Balance
$126,770
Interest Rate
5.89%
Estimated Equity
$1,044,160
Purchase Details
Closed on
Jul 13, 2000
Sold by
Adams Sherry N
Bought by
Adams Richard C
Home Financials for this Owner
Home Financials are based on the most recent Mortgage that was taken out on this home.
Original Mortgage
$217,000
Interest Rate
5.1%
Purchase Details
Closed on
Dec 9, 1996
Sold by
Long Jean
Bought by
Adams Richard C and Adams Sherry N
Home Financials for this Owner
Home Financials are based on the most recent Mortgage that was taken out on this home.
Original Mortgage
$149,925
Interest Rate
7.59%
Create a Home Valuation Report for This Property
The Home Valuation Report is an in-depth analysis detailing your home's value as well as a comparison with similar homes in the area
Home Values in the Area
Average Home Value in this Area
Purchase History
| Date | Buyer | Sale Price | Title Company |
|---|---|---|---|
| Adams Richard C | -- | North American Title Co | |
| Adams Richard C | -- | American Title Co | |
| Adams Richard C | $200,000 | North American Title Co |
Source: Public Records
Mortgage History
| Date | Status | Borrower | Loan Amount |
|---|---|---|---|
| Open | Adams Richard C | $300,000 | |
| Closed | Adams Richard C | $217,000 | |
| Closed | Adams Richard C | $149,925 | |
| Closed | Adams Richard C | $19,990 |
Source: Public Records
Tax History
| Year | Tax Paid | Tax Assessment Tax Assessment Total Assessment is a certain percentage of the fair market value that is determined by local assessors to be the total taxable value of land and additions on the property. | Land | Improvement |
|---|---|---|---|---|
| 2025 | $4,268 | $325,549 | $244,943 | $80,606 |
| 2024 | $4,268 | $319,167 | $240,141 | $79,026 |
| 2023 | $4,202 | $312,910 | $235,433 | $77,477 |
| 2022 | $3,953 | $306,775 | $230,817 | $75,958 |
| 2021 | $3,873 | $300,761 | $226,292 | $74,469 |
| 2019 | $3,815 | $291,842 | $219,581 | $72,261 |
| 2018 | $3,630 | $286,121 | $215,276 | $70,845 |
| 2016 | $3,326 | $275,012 | $206,917 | $68,095 |
| 2015 | $3,194 | $270,882 | $203,809 | $67,073 |
| 2014 | $3,175 | $265,577 | $199,817 | $65,760 |
Source: Public Records
Map
Nearby Homes
- 1875 Mcnab Ave
- 1848 N College Cir
- 1881 Hackett Ave
- 2410 2412 Termino Ave
- 7890 4A E Spring St Unit 4A
- 2411 2413 Termino
- 1401 Hackett Ave
- 6510 E Driscoll St
- 6470 E Mantova St
- 2276 Fanwood Ave
- 1032 Palo Verde Ave
- 1837 N Studebaker Rd
- 6426 E Belice St
- 2306 Carfax Ave
- 2330 Josie Ave
- 6448 E Los Arcos St
- 6301 E Bixby Hill Rd
- 1210 Los Altos Ave
- 6702 E El Salvador St
- 1205 Bryant Rd
- 1818 Mcnab Ave
- 1800 Mcnab Ave
- 1811 Snowden Ave
- 1801 Snowden Ave
- 1821 Snowden Ave
- 1831 Snowden Ave
- 1809 Mcnab Ave
- 1834 Mcnab Ave
- 1817 Mcnab Ave
- 1801 Mcnab Ave
- 1825 Mcnab Ave
- 1841 Snowden Ave
- 1842 Mcnab Ave
- 1833 Mcnab Ave
- 1851 Snowden Ave
- 1810 Snowden Ave
- 1800 Snowden Ave
- 1820 Snowden Ave
- 1896 N College Cir
- 1898 N College Cir