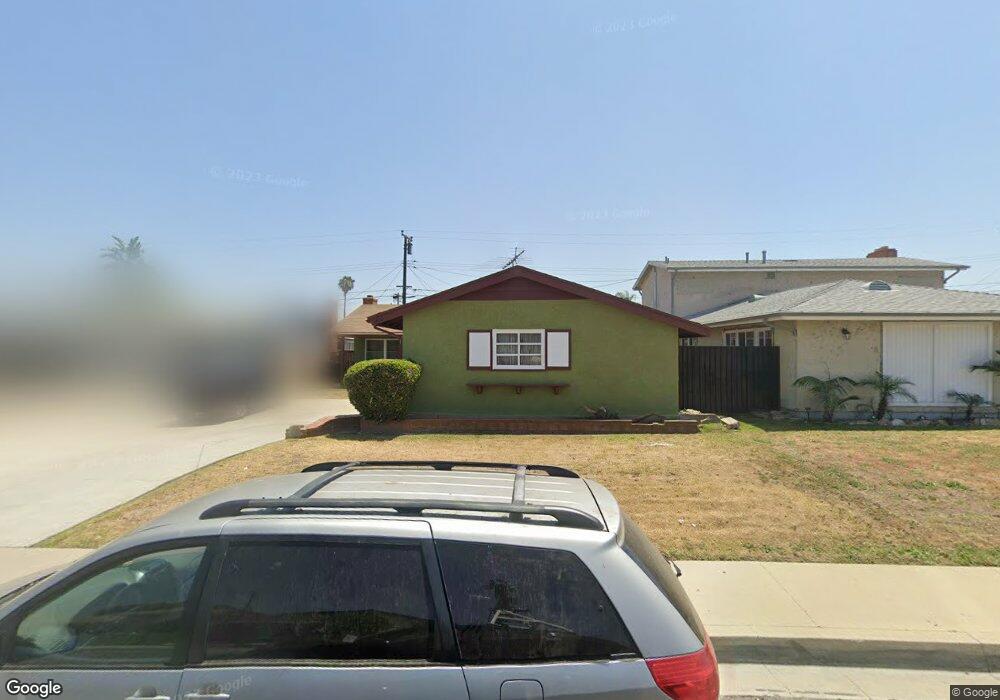
1810 W 133rd St Compton, CA 90222
Estimated Value: $596,871 - $677,000
3
Beds
2
Baths
1,161
Sq Ft
$551/Sq Ft
Est. Value
About This Home
This home is located at 1810 W 133rd St, Compton, CA 90222 and is currently estimated at $639,468, approximately $550 per square foot. 1810 W 133rd St is a home located in Los Angeles County with nearby schools including Ronald E. McNair Elementary School, Enterprise Middle School, and Centennial High School.
Ownership History
Date
Name
Owned For
Owner Type
Purchase Details
Closed on
Dec 24, 1996
Sold by
Byther Corey Earl
Bought by
Byther Ireneta E
Current Estimated Value
Home Financials for this Owner
Home Financials are based on the most recent Mortgage that was taken out on this home.
Original Mortgage
$125,767
Interest Rate
7.59%
Mortgage Type
FHA
Purchase Details
Closed on
Nov 15, 1996
Sold by
Burks James
Bought by
Byther Treneta and Davis Genevieve
Home Financials for this Owner
Home Financials are based on the most recent Mortgage that was taken out on this home.
Original Mortgage
$125,767
Interest Rate
7.59%
Mortgage Type
FHA
Create a Home Valuation Report for This Property
The Home Valuation Report is an in-depth analysis detailing your home's value as well as a comparison with similar homes in the area
Home Values in the Area
Average Home Value in this Area
Purchase History
| Date | Buyer | Sale Price | Title Company |
|---|---|---|---|
| Byther Ireneta E | -- | Fidelity National Title Ins | |
| Byther Treneta | -- | Fidelity National Title Ins |
Source: Public Records
Mortgage History
| Date | Status | Borrower | Loan Amount |
|---|---|---|---|
| Previous Owner | Byther Treneta | $125,767 |
Source: Public Records
Tax History
| Year | Tax Paid | Tax Assessment Tax Assessment Total Assessment is a certain percentage of the fair market value that is determined by local assessors to be the total taxable value of land and additions on the property. | Land | Improvement |
|---|---|---|---|---|
| 2025 | $4,133 | $206,816 | $89,074 | $117,742 |
| 2024 | $4,133 | $202,762 | $87,328 | $115,434 |
| 2023 | $4,073 | $198,787 | $85,616 | $113,171 |
| 2022 | $3,539 | $194,890 | $83,938 | $110,952 |
| 2021 | $3,567 | $191,070 | $82,293 | $108,777 |
| 2019 | $3,466 | $185,404 | $79,853 | $105,551 |
| 2018 | $3,330 | $181,770 | $78,288 | $103,482 |
| 2016 | $3,166 | $174,713 | $75,249 | $99,464 |
| 2015 | $3,030 | $172,089 | $74,119 | $97,970 |
| 2014 | $2,979 | $168,719 | $72,668 | $96,051 |
Source: Public Records
Map
Nearby Homes
- 1805 N Central Ave
- 1418 W 134th St
- 1918 W Piru St
- 2109 N Bahama Ave
- 1619 W 136th St
- 1410 W Stockwell St
- 1406 W Stockwell St
- 2015 N Belhaven Ave
- 2215 W 132nd St
- 1209 W 136th St
- 810 W 133rd St
- 1201 W 138th St
- 14003 S Nestor Ave
- 9607 S Evers Ave
- 14016 S Albertson Ave
- 1036 W Stockwell St
- 825 Sweetbay Ln
- 14118 S Zamora Ave
- 0 W 134th Place
- 1716 N Grandee Ave
- 1808 W 133rd St
- 1816 W 133rd St
- 1802 W 133rd St
- 1902 W 133rd St
- 1811 W 134th St
- 1805 W 134th St
- 1803 W 134th St
- 1903 W 134th St
- 1716 W 133rd St
- 1908 W 133rd St
- 1811 W 133rd St
- 1805 W 133rd St
- 1813 W 133rd St
- 1803 W 133rd St
- 1713 W 134th St
- 1905 W 134th St
- 1903 W 133rd St
- 1910 W 133rd St
- 1713 W 133rd St
- 1905 W 133rd St
Your Personal Tour Guide
Ask me questions while you tour the home.