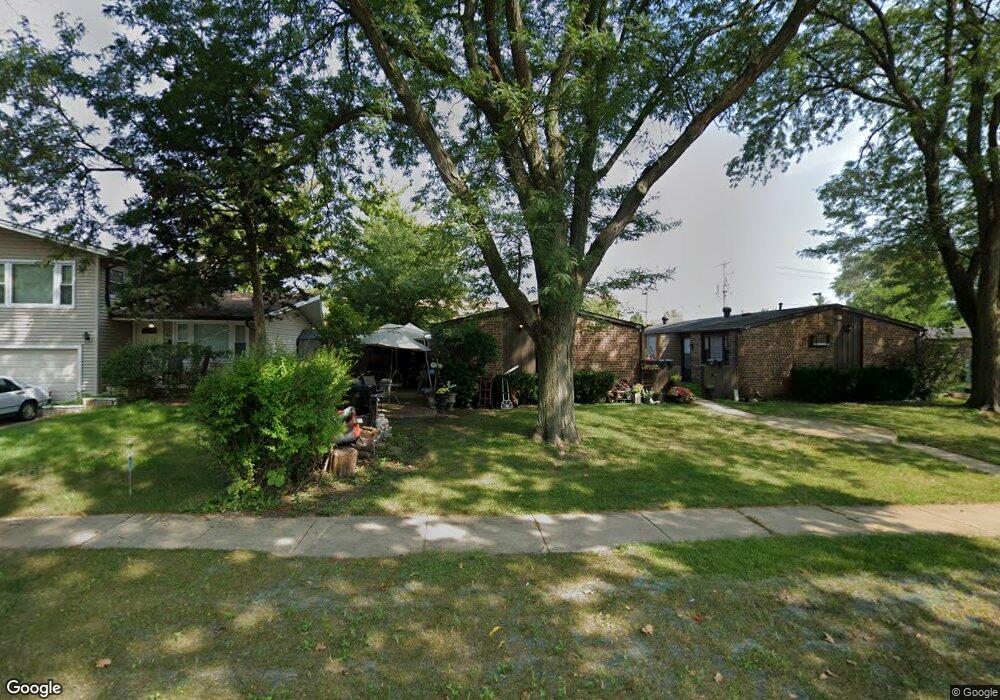
1810 Walnut St Unit 1 Saint Charles, IL 60174
Southwest Saint Charles NeighborhoodEstimated Value: $444,000 - $531,000
Studio
--
Bath
2,820
Sq Ft
$168/Sq Ft
Est. Value
About This Home
This home is located at 1810 Walnut St Unit 1, Saint Charles, IL 60174 and is currently estimated at $474,977, approximately $168 per square foot. 1810 Walnut St Unit 1 is a home located in Kane County with nearby schools including Richmond Intermediate School, Davis Primary School, and Thompson Middle School.
Ownership History
Date
Name
Owned For
Owner Type
Purchase Details
Closed on
Dec 8, 2016
Sold by
Dennison Brad D and Dennison Pek Hwa
Bought by
Brad & Pekhwa Llc
Current Estimated Value
Purchase Details
Closed on
Oct 14, 1997
Sold by
Griffin Business Company
Bought by
Dennison Brad D and Dennison Pek Hwa
Purchase Details
Closed on
Oct 10, 1997
Sold by
Griffin Warren Randall and Griffin Karen Ann
Bought by
Griffin Business Company
Create a Home Valuation Report for This Property
The Home Valuation Report is an in-depth analysis detailing your home's value as well as a comparison with similar homes in the area
Home Values in the Area
Average Home Value in this Area
Purchase History
| Date | Buyer | Sale Price | Title Company |
|---|---|---|---|
| Brad & Pekhwa Llc | -- | None Available | |
| Dennison Brad D | $140,000 | Premier Title Company | |
| Griffin Business Company | -- | -- |
Source: Public Records
Tax History
| Year | Tax Paid | Tax Assessment Tax Assessment Total Assessment is a certain percentage of the fair market value that is determined by local assessors to be the total taxable value of land and additions on the property. | Land | Improvement |
|---|---|---|---|---|
| 2024 | $9,503 | $128,020 | $41,894 | $86,126 |
| 2023 | $9,170 | $114,580 | $37,496 | $77,084 |
| 2022 | $9,357 | $115,888 | $41,504 | $74,384 |
| 2021 | $9,009 | $110,465 | $39,562 | $70,903 |
| 2020 | $8,922 | $108,405 | $38,824 | $69,581 |
| 2019 | $8,770 | $106,258 | $38,055 | $68,203 |
| 2018 | $7,755 | $93,498 | $36,609 | $56,889 |
| 2017 | $7,566 | $90,301 | $35,357 | $54,944 |
| 2016 | $7,660 | $83,848 | $34,115 | $49,733 |
| 2015 | -- | $80,408 | $33,747 | $46,661 |
| 2014 | -- | $79,901 | $33,747 | $46,154 |
| 2013 | -- | $80,700 | $34,084 | $46,616 |
Source: Public Records
Map
Nearby Homes
- 203 Fairview Dr
- 152 Walnut Dr Unit 7
- 1312 Dean St
- Lot 15 Debruyne
- 1342 S 14th St Unit A2
- 910 Thornwood Dr Unit 910
- 907 Thornwood Ct Unit 2
- 36W787 Red Haw Ln
- 2925 Pleasant Plains Dr Unit 2925
- 266 Grand Ridge Rd
- 3049 Renard Ln Unit 2
- 3122 W Main St
- 524 Bradbury Ln
- 2187 Vanderbilt Dr
- 544 Bradbury Ln Unit 544
- 3208 Raphael Ct
- 505 Mosedale St
- 525 Bradbury Ln Unit 525
- 3201 Renard Ln
- 1028 S 5th St
- 1814 Walnut St
- 1720 Walnut St Unit 1
- 1816 Walnut St
- 1822 Walnut St
- 1811 Walnut St
- 1713 Walnut St
- 1819 Walnut St
- 105 S 18th St
- 1700 Walnut St Unit 4
- 1700 Walnut St Unit 5
- 1700 Walnut St Unit 2
- 1700 Walnut St Unit 7
- 108 S 18th St
- 106 S 19th St
- 111 S 18th St
- 101 S 17th St
- 101 S 17th St Unit D
- 101 S 17th St Unit D
- 114 S 18th St
- 110 S 19th St
Your Personal Tour Guide
Ask me questions while you tour the home.