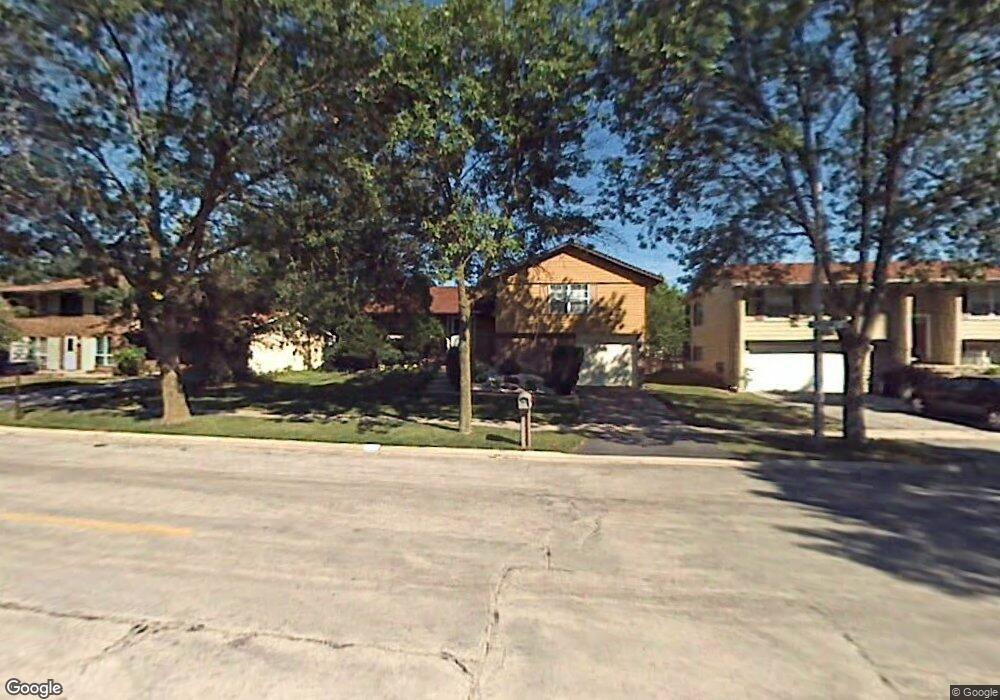
18101 Fountainbleau Dr Hazel Crest, IL 60429
Chateaux-Versailles NeighborhoodEstimated Value: $212,000 - $228,000
3
Beds
1
Bath
976
Sq Ft
$227/Sq Ft
Est. Value
About This Home
This home is located at 18101 Fountainbleau Dr, Hazel Crest, IL 60429 and is currently estimated at $221,471, approximately $226 per square foot. 18101 Fountainbleau Dr is a home located in Cook County with nearby schools including Chateaux School, Prairie-Hills Junior High School, and Hillcrest High School.
Ownership History
Date
Name
Owned For
Owner Type
Purchase Details
Closed on
Oct 19, 2001
Sold by
Bankfinancial Fsb
Bought by
Martin Demitria L
Current Estimated Value
Home Financials for this Owner
Home Financials are based on the most recent Mortgage that was taken out on this home.
Original Mortgage
$117,232
Outstanding Balance
$45,989
Interest Rate
6.92%
Mortgage Type
FHA
Estimated Equity
$175,482
Purchase Details
Closed on
Jan 1, 2001
Sold by
Hud
Bought by
Financial Federal Trust & Svgs Bank Trus
Purchase Details
Closed on
Jul 18, 1995
Sold by
Banister Virsia
Bought by
Hud
Purchase Details
Closed on
Nov 1, 1993
Sold by
Cage Orville and Cage Lakitha
Bought by
Banister Virsia
Create a Home Valuation Report for This Property
The Home Valuation Report is an in-depth analysis detailing your home's value as well as a comparison with similar homes in the area
Home Values in the Area
Average Home Value in this Area
Purchase History
| Date | Buyer | Sale Price | Title Company |
|---|---|---|---|
| Martin Demitria L | $118,500 | Ticor Title | |
| Financial Federal Trust & Svgs Bank Trus | -- | Stewart Title | |
| Hud | -- | -- | |
| Banister Virsia | -- | -- |
Source: Public Records
Mortgage History
| Date | Status | Borrower | Loan Amount |
|---|---|---|---|
| Open | Martin Demitria L | $117,232 |
Source: Public Records
Tax History Compared to Growth
Tax History
| Year | Tax Paid | Tax Assessment Tax Assessment Total Assessment is a certain percentage of the fair market value that is determined by local assessors to be the total taxable value of land and additions on the property. | Land | Improvement |
|---|---|---|---|---|
| 2024 | $7,010 | $17,000 | $2,855 | $14,145 |
| 2023 | $4,730 | $17,000 | $2,855 | $14,145 |
| 2022 | $4,730 | $9,864 | $2,447 | $7,417 |
| 2021 | $4,622 | $9,863 | $2,447 | $7,416 |
| 2020 | $4,541 | $9,863 | $2,447 | $7,416 |
| 2019 | $3,976 | $9,367 | $2,243 | $7,124 |
| 2018 | $3,849 | $9,367 | $2,243 | $7,124 |
| 2017 | $3,632 | $9,367 | $2,243 | $7,124 |
| 2016 | $2,928 | $7,505 | $2,039 | $5,466 |
| 2015 | $2,734 | $7,505 | $2,039 | $5,466 |
| 2014 | $2,697 | $7,505 | $2,039 | $5,466 |
| 2013 | $3,151 | $9,208 | $2,039 | $7,169 |
Source: Public Records
Map
Nearby Homes
- 18018 Chantilly Ln Unit S3
- 18108 Fountainbleau Dr
- 3525 Marseilles Ln
- 17922 Normandy Ln
- 3411 Montmarte Ave
- 18208 Fountainbleau Dr
- 3406 Seine Ct
- 3407 Fountainbleau Dr
- 18106 Charlemagne Ave
- 3400 Seine Ct
- 17861 Harvard Ln
- 18120 Versailles Ln
- 17850 Yale Ln
- 3255 183rd St
- 3360 184th St Unit 3W
- 3761 Kirk Ct
- 3505 Lakeview Dr Unit 204
- 17710 Harvard Ln
- 3861 178th Place
- 17910 Millstone Rd
- 3501 Marseilles Ln
- 3513 Fountainbleau Dr
- 3503 Marseilles Ln
- 3505 Bordeaux Ct
- 3511 Fountainbleau Dr
- 3519 Bordeaux Ct
- 3507 Bordeaux Ct Unit S4
- 3509 Fountainbleau Dr
- 3512 Fountainbleau Dr
- 18100 Fountainbleau Dr Unit S4
- 18111 Fountainbleau Dr
- 3502 Marseilles Ln
- 18020 Chantilly Ln
- 18102 Fountainbleau Dr
- 3509 Bordeaux Ct
- 3510 Fountainbleau Dr
- 3504 Marseilles Ln
- 3507 Fountainbleau Dr
- 18106 Fountainbleau Dr
- 3508 Fountainbleau Dr Unit S3