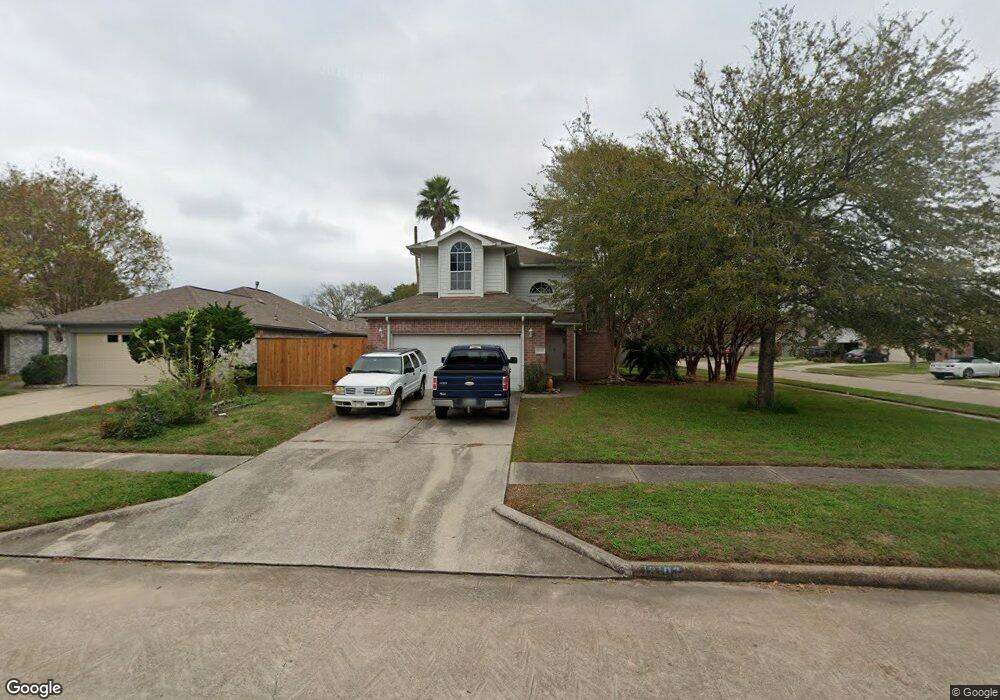
18102 Gravenhurst Ln Tomball, TX 77377
Northpointe NeighborhoodEstimated Value: $275,000 - $326,000
3
Beds
3
Baths
2,080
Sq Ft
$145/Sq Ft
Est. Value
About This Home
This home is located at 18102 Gravenhurst Ln, Tomball, TX 77377 and is currently estimated at $302,630, approximately $145 per square foot. 18102 Gravenhurst Ln is a home located in Harris County with nearby schools including Willow Creek Elementary School, Willow Wood Junior High School, and Northpointe Intermediate School.
Ownership History
Date
Name
Owned For
Owner Type
Purchase Details
Closed on
Nov 23, 2010
Sold by
Skyles Anne C and Skyles Robert R
Bought by
Vincent Bertha F
Current Estimated Value
Home Financials for this Owner
Home Financials are based on the most recent Mortgage that was taken out on this home.
Original Mortgage
$120,859
Outstanding Balance
$80,671
Interest Rate
4.5%
Mortgage Type
FHA
Estimated Equity
$221,959
Purchase Details
Closed on
May 28, 2002
Sold by
Vincelette James F and Vincelette Glenda A
Bought by
Skyles Robert R and Skyles Anne C
Home Financials for this Owner
Home Financials are based on the most recent Mortgage that was taken out on this home.
Original Mortgage
$87,200
Interest Rate
6.92%
Purchase Details
Closed on
Nov 27, 1995
Sold by
Jmc Homes Inc
Bought by
Vincelette James F and Vincelette Glenda A
Home Financials for this Owner
Home Financials are based on the most recent Mortgage that was taken out on this home.
Original Mortgage
$88,200
Interest Rate
7.36%
Create a Home Valuation Report for This Property
The Home Valuation Report is an in-depth analysis detailing your home's value as well as a comparison with similar homes in the area
Home Values in the Area
Average Home Value in this Area
Purchase History
| Date | Buyer | Sale Price | Title Company |
|---|---|---|---|
| Vincent Bertha F | -- | Stewart Title Houston Div | |
| Skyles Robert R | -- | Chicago Title | |
| Vincelette James F | -- | Stewart Title |
Source: Public Records
Mortgage History
| Date | Status | Borrower | Loan Amount |
|---|---|---|---|
| Open | Vincent Bertha F | $120,859 | |
| Previous Owner | Skyles Robert R | $87,200 | |
| Previous Owner | Vincelette James F | $88,200 |
Source: Public Records
Tax History Compared to Growth
Tax History
| Year | Tax Paid | Tax Assessment Tax Assessment Total Assessment is a certain percentage of the fair market value that is determined by local assessors to be the total taxable value of land and additions on the property. | Land | Improvement |
|---|---|---|---|---|
| 2025 | $7,429 | $311,756 | $43,304 | $268,452 |
| 2024 | $7,429 | $318,518 | $43,304 | $275,214 |
| 2023 | $7,429 | $311,452 | $50,779 | $260,673 |
| 2022 | $6,679 | $267,710 | $42,693 | $225,017 |
| 2021 | $5,510 | $213,864 | $35,578 | $178,286 |
| 2020 | $5,223 | $193,897 | $32,344 | $161,553 |
| 2019 | $5,403 | $196,557 | $22,640 | $173,917 |
| 2018 | $2,386 | $178,048 | $19,406 | $158,642 |
| 2017 | $4,990 | $178,048 | $19,406 | $158,642 |
| 2016 | $4,446 | $158,638 | $19,406 | $139,232 |
| 2015 | $3,828 | $158,638 | $19,406 | $139,232 |
| 2014 | $3,828 | $129,941 | $19,406 | $110,535 |
Source: Public Records
Map
Nearby Homes
- 18135 Gravenhurst Ln
- 12331 Westwold Dr
- 12242 Westlock Dr
- 12226 Westwold Dr
- 18703 Summercliff Ln
- 19307 Hillside Pasture Ln
- 20618 Yearling Pasture Ln
- 19243 Palfrey Prairie Trail
- 19219 Palfrey Prairie Trail
- 19326 Palfrey Prairie Trail
- 17814 Winkler Willow Ct
- 12107 Westwold Dr
- 12414 Montebello Manor Ln
- 18522 Cascade Timbers Ln
- 12046 Westlock Dr
- 12506 Opal Valley Dr
- 12703 Songhollow Dr
- 12007 Northpointe Meadows Dr
- 12222 Brighton Brook Ln
- 12022 Canyon Star Ln
- 18106 Gravenhurst Ln
- 18110 Gravenhurst Ln
- 18103 Eganville Cir
- 18107 Eganville Cir
- 18112 Gravenhurst Ln
- 12411 Westlock Dr
- 18109 Eganville Cir
- 12415 Westlock Dr
- 12407 Westlock Dr
- 18103 Gravenhurst Ln
- 12419 Westlock Dr
- 12403 Westlock Dr
- 18107 Gravenhurst Ln
- 18111 Eganville Cir
- 12423 Westlock Dr
- 18114 Gravenhurst Ln
- 18109 Gravenhurst Ln
- 12335 Westlock Dr
- 12427 Westlock Dr
- 18111 Gravenhurst Ln