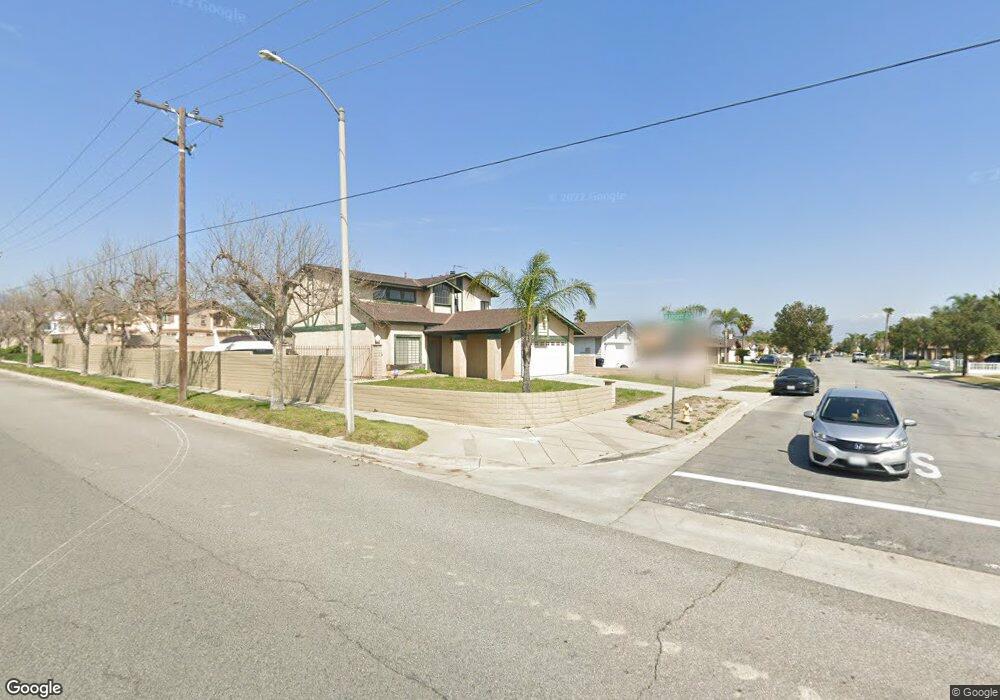
18102 Montgomery Ave Fontana, CA 92336
Estimated Value: $612,000 - $636,206
3
Beds
3
Baths
1,544
Sq Ft
$404/Sq Ft
Est. Value
About This Home
This home is located at 18102 Montgomery Ave, Fontana, CA 92336 and is currently estimated at $623,552, approximately $403 per square foot. 18102 Montgomery Ave is a home located in San Bernardino County with nearby schools including Locust Elementary School, Alder Middle School, and Fontana A. B. Miller High School.
Ownership History
Date
Name
Owned For
Owner Type
Purchase Details
Closed on
Sep 9, 2004
Sold by
Brown Herndon Vicki Sherrelle and Brown Vicki Sherrelle
Bought by
Herndon Melvin and Brown Herndon Vicki Sherrelle
Current Estimated Value
Home Financials for this Owner
Home Financials are based on the most recent Mortgage that was taken out on this home.
Original Mortgage
$232,500
Outstanding Balance
$114,262
Interest Rate
5.76%
Mortgage Type
New Conventional
Estimated Equity
$509,290
Purchase Details
Closed on
Feb 23, 1996
Sold by
Darmiento Frank R and Darmiento Orlanda E
Bought by
Brown Vicki Sherrelle
Home Financials for this Owner
Home Financials are based on the most recent Mortgage that was taken out on this home.
Original Mortgage
$113,349
Interest Rate
7.8%
Mortgage Type
FHA
Purchase Details
Closed on
Feb 10, 1995
Sold by
Gonzales Robert A and Gonzales Maricela
Bought by
Hud
Create a Home Valuation Report for This Property
The Home Valuation Report is an in-depth analysis detailing your home's value as well as a comparison with similar homes in the area
Home Values in the Area
Average Home Value in this Area
Purchase History
| Date | Buyer | Sale Price | Title Company |
|---|---|---|---|
| Herndon Melvin | -- | Lawyers Title Company | |
| Brown Vicki Sherrelle | $114,000 | Continental Lawyers Title | |
| Hud | $131,679 | -- | |
| Hud | $131,679 | Commonwealth Land Title Co |
Source: Public Records
Mortgage History
| Date | Status | Borrower | Loan Amount |
|---|---|---|---|
| Open | Herndon Melvin | $232,500 | |
| Previous Owner | Brown Vicki Sherrelle | $113,349 |
Source: Public Records
Tax History Compared to Growth
Tax History
| Year | Tax Paid | Tax Assessment Tax Assessment Total Assessment is a certain percentage of the fair market value that is determined by local assessors to be the total taxable value of land and additions on the property. | Land | Improvement |
|---|---|---|---|---|
| 2025 | $3,123 | $189,385 | $47,346 | $142,039 |
| 2024 | $3,123 | $185,672 | $46,418 | $139,254 |
| 2023 | $3,041 | $182,032 | $45,508 | $136,524 |
| 2022 | $2,990 | $178,463 | $44,616 | $133,847 |
| 2021 | $2,940 | $174,964 | $43,741 | $131,223 |
| 2020 | $2,903 | $173,169 | $43,292 | $129,877 |
| 2019 | $2,826 | $169,773 | $42,443 | $127,330 |
| 2018 | $2,810 | $166,444 | $41,611 | $124,833 |
| 2017 | $2,757 | $163,180 | $40,795 | $122,385 |
| 2016 | $2,700 | $159,980 | $39,995 | $119,985 |
| 2015 | $2,635 | $157,577 | $39,394 | $118,183 |
| 2014 | $3,512 | $154,490 | $38,622 | $115,868 |
Source: Public Records
Map
Nearby Homes
- 18281 Montgomery Ave
- 7398 N Maple Ave
- 956 N Sandalwood Ave
- 7724 Myles Ct
- 7835 Laurel Ave
- 7870 Williams Rd
- 645 N Maple Ave
- 17806 Terry St
- 7852 Grace Ave
- 7925 Spohn Ave
- 17571 Shamrock Ave
- 1159 N Wisteria Ave
- 1670 Phantom Ln
- 1793 Hornet Rd
- 1150 Thunderchief Ln
- 1724 Eagle Rd
- 1333 Yeager Ave
- 1142 Thunderchief Ln
- 1668 Phantom Ln
- 1660 Phantom Ln
- 18104 Montgomery Ave
- 18106 Montgomery Ave
- 18125 Grove Place
- 18131 Grove Place
- 7355 Frankfort Ave
- 7365 Frankfort Ave
- 18110 Montgomery Ave
- 7345 Frankfort Ave
- 18103 Montgomery Ave
- 18105 Montgomery Ave
- 7335 Frankfort Ave
- 18141 Grove Place
- 18107 Montgomery Ave
- 18112 Montgomery Ave
- 18075 Montgomery Ave
- 7325 Frankfort Ave
- 18111 Montgomery Ave
- 18124 Grove Place
- 18151 Grove Place
- 18065 Montgomery Ave