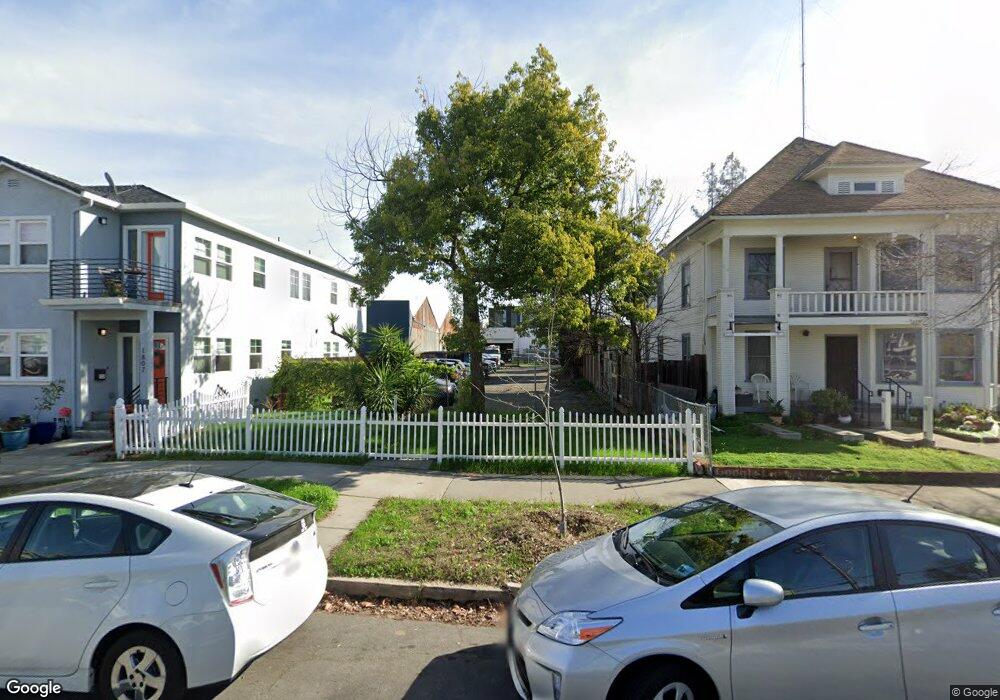
1811 26th St Sacramento, CA 95816
Newton Booth NeighborhoodEstimated Value: $258,000 - $633,000
2
Beds
1
Bath
910
Sq Ft
$512/Sq Ft
Est. Value
About This Home
This home is located at 1811 26th St, Sacramento, CA 95816 and is currently estimated at $466,010, approximately $512 per square foot. 1811 26th St is a home located in Sacramento County with nearby schools including Theodore Judah Elementary, Miwok Middle School, and C. K. McClatchy High.
Ownership History
Date
Name
Owned For
Owner Type
Purchase Details
Closed on
Jan 31, 2020
Sold by
Chill Properties Llc
Bought by
Capitol Investments Llc
Current Estimated Value
Purchase Details
Closed on
Jul 3, 2013
Sold by
Joe Jones Properties
Bought by
Chill Properties Llc
Purchase Details
Closed on
May 28, 2010
Sold by
Carrola Rachel
Bought by
Joe Jones Properties
Create a Home Valuation Report for This Property
The Home Valuation Report is an in-depth analysis detailing your home's value as well as a comparison with similar homes in the area
Home Values in the Area
Average Home Value in this Area
Purchase History
| Date | Buyer | Sale Price | Title Company |
|---|---|---|---|
| Capitol Investments Llc | $450,000 | Placer Title Company | |
| Chill Properties Llc | $37,500 | None Available | |
| Joe Jones Properties | $224,000 | Placer Title Company |
Source: Public Records
Tax History Compared to Growth
Tax History
| Year | Tax Paid | Tax Assessment Tax Assessment Total Assessment is a certain percentage of the fair market value that is determined by local assessors to be the total taxable value of land and additions on the property. | Land | Improvement |
|---|---|---|---|---|
| 2025 | $5,594 | $492,139 | $492,139 | -- |
| 2024 | $5,594 | $482,490 | $482,490 | -- |
| 2023 | $5,463 | $473,030 | $473,030 | $0 |
| 2022 | $5,450 | $463,755 | $463,755 | $0 |
| 2021 | $5,190 | $454,662 | $454,662 | $0 |
| 2020 | $2,984 | $252,199 | $252,199 | $0 |
| 2019 | $2,921 | $247,254 | $247,254 | $0 |
| 2018 | $2,847 | $242,406 | $242,406 | $0 |
| 2017 | $2,810 | $237,653 | $237,653 | $0 |
| 2016 | $2,727 | $232,994 | $232,994 | $0 |
| 2015 | $2,689 | $229,495 | $229,495 | $0 |
| 2014 | -- | $234,801 | $176,000 | $58,801 |
Source: Public Records
Map
Nearby Homes