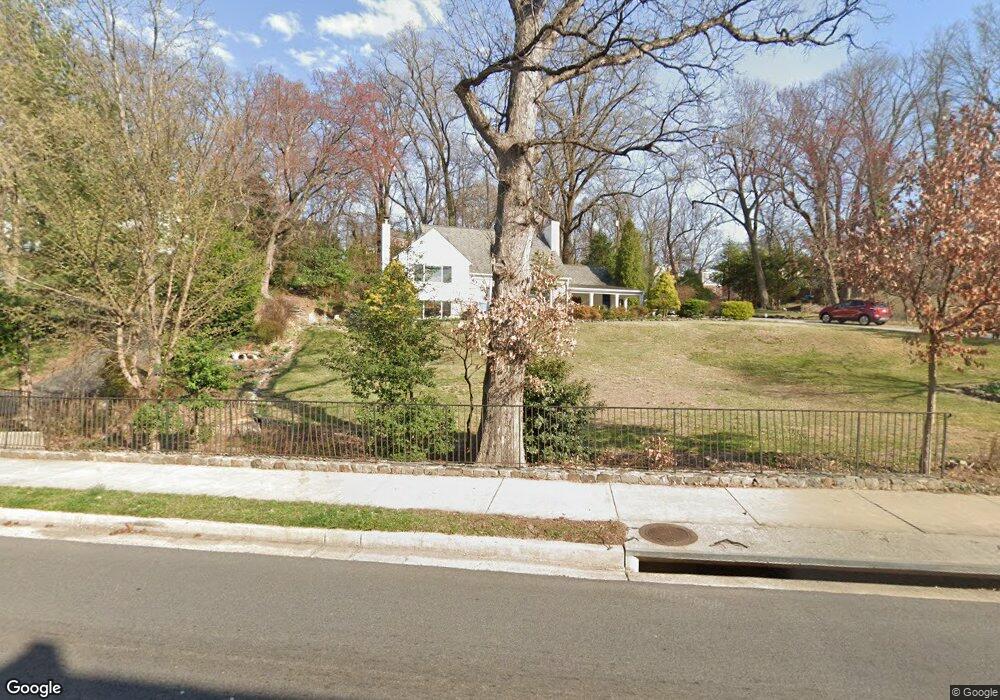
1811 Army Navy Dr Arlington, VA 22202
Arlington Ridge NeighborhoodEstimated Value: $1,094,000 - $1,156,624
3
Beds
3
Baths
2,154
Sq Ft
$520/Sq Ft
Est. Value
About This Home
This home is located at 1811 Army Navy Dr, Arlington, VA 22202 and is currently estimated at $1,119,156, approximately $519 per square foot. 1811 Army Navy Dr is a home located in Arlington County with nearby schools including Oakridge Elementary School, Gunston Middle School, and Wakefield High School.
Ownership History
Date
Name
Owned For
Owner Type
Purchase Details
Closed on
Aug 24, 2021
Sold by
Mentis John Anthony and Mccowan James R
Bought by
Mentis John A and Mccowan James R
Current Estimated Value
Purchase Details
Closed on
Oct 25, 2018
Sold by
Mentis John A and John Anthony Mentis Revocable
Bought by
Mentis John A and Mentis John Anthony
Home Financials for this Owner
Home Financials are based on the most recent Mortgage that was taken out on this home.
Original Mortgage
$768,000
Interest Rate
4.7%
Mortgage Type
New Conventional
Purchase Details
Closed on
May 15, 2018
Sold by
Ments John A
Bought by
Mentis John Anthony and John Anthony Mentis Revocable
Purchase Details
Closed on
Dec 8, 1997
Sold by
Hays North + Margaret Ann
Bought by
Mentis John A
Home Financials for this Owner
Home Financials are based on the most recent Mortgage that was taken out on this home.
Original Mortgage
$198,750
Interest Rate
7.28%
Mortgage Type
New Conventional
Create a Home Valuation Report for This Property
The Home Valuation Report is an in-depth analysis detailing your home's value as well as a comparison with similar homes in the area
Home Values in the Area
Average Home Value in this Area
Purchase History
| Date | Buyer | Sale Price | Title Company |
|---|---|---|---|
| Mentis John A | -- | None Listed On Document | |
| Mentis John A | -- | None Available | |
| Mentis John A | -- | None Available | |
| Mentis John A | -- | None Available | |
| Mentis John Anthony | -- | None Available | |
| Mentis John A | $265,000 | First American Title Insuran |
Source: Public Records
Mortgage History
| Date | Status | Borrower | Loan Amount |
|---|---|---|---|
| Previous Owner | Mentis John A | $768,000 | |
| Previous Owner | Mentis John A | $198,750 |
Source: Public Records
Tax History Compared to Growth
Tax History
| Year | Tax Paid | Tax Assessment Tax Assessment Total Assessment is a certain percentage of the fair market value that is determined by local assessors to be the total taxable value of land and additions on the property. | Land | Improvement |
|---|---|---|---|---|
| 2025 | $10,893 | $1,054,500 | $854,200 | $200,300 |
| 2024 | $10,879 | $1,053,100 | $854,200 | $198,900 |
| 2023 | $10,698 | $1,038,600 | $854,200 | $184,400 |
| 2022 | $10,610 | $1,030,100 | $835,200 | $194,900 |
| 2021 | $6,616 | $642,300 | $447,400 | $194,900 |
| 2020 | $6,400 | $623,800 | $429,500 | $194,300 |
| 2019 | $6,214 | $605,700 | $411,600 | $194,100 |
| 2018 | $5,892 | $585,700 | $393,700 | $192,000 |
| 2017 | $5,603 | $557,000 | $366,900 | $190,100 |
| 2016 | $5,272 | $532,000 | $357,900 | $174,100 |
| 2015 | $5,381 | $540,300 | $357,900 | $182,400 |
| 2014 | $5,062 | $508,200 | $340,000 | $168,200 |
Source: Public Records
Map
Nearby Homes
- 2001 Army Navy Dr
- 2100 S Pierce St
- 1753 Army Navy Dr
- 1417 21st St S
- 1130 17th St S
- 2317 S Queen St
- 2319 S Queen St
- 1701 S Arlington Ridge Rd
- 1230 23rd St S
- 2322 S Pierce St
- 2322 S Arlington Ridge Rd
- 2345 S Rolfe St
- 1019 21st St S
- 1022 21st St S
- 2356 S Pierce St
- 1515 S Arlington Ridge Rd Unit 603
- 1334 S Quinn St
- 2007 S Joyce St
- 1611 13th St S
- 1200 S Arlington Ridge Rd Unit 509
- 1815 Army Navy Dr
- 1901 Army Navy Dr
- 1509 20th St S
- 1505 20th St S
- 1515 20th St S
- 1521 20th St S
- 1417 20th St S
- 1350 19th Rd S
- 1781 Army Navy Dr
- 1348 19th Rd S
- 1413 20th St S
- 1347 19th Rd S
- 1340 19th Rd S
- 1409 20th St S
- 1771 Army Navy Dr
- 1328 19th Rd S
- 1500 20th St S
- 1506 20th St S
- 1512 20th St S
- 1339 19th Rd S