S
Seller's Agent in 2016
Sherry Sullivan
Inactive Office
Estimated Value: $144,000 - $209,962
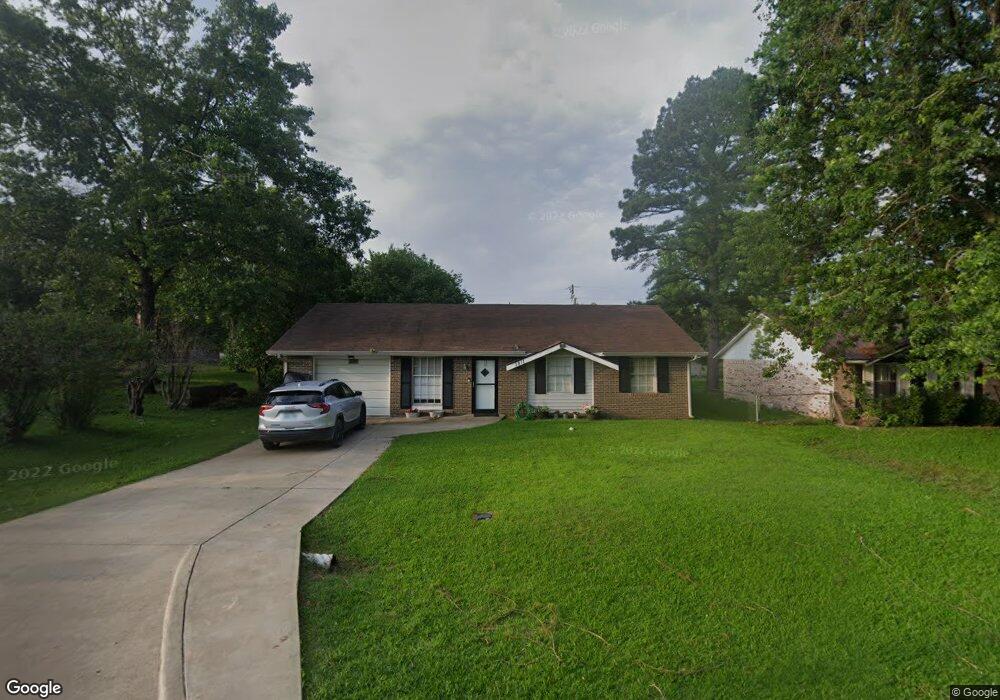
Located in a Subdivision, Northern Exposure
Last Agent to Sell the Property
Sherry Sullivan
Inactive Office License #126652 Listed on: 09/09/2016
Last Buyer's Agent
Sherry Sullivan
Inactive Office License #126652 Listed on: 09/09/2016
| Date | Buyer | Sale Price | Title Company |
|---|---|---|---|
| Vanworth David | $124,000 | Fidelity National Title | |
| Newell Christopher S | $74,500 | None Available |
| Date | Status | Borrower | Loan Amount |
|---|---|---|---|
| Open | Vanworth David | $117,800 | |
| Previous Owner | Newell Christopher S | $75,252 |
| Date | Event | Price | List to Sale | Price per Sq Ft |
|---|---|---|---|---|
| 10/31/2016 10/31/16 | Sold | $74,500 | 0.0% | $66 / Sq Ft |
| 09/09/2016 09/09/16 | Pending | -- | -- | -- |
| 09/09/2016 09/09/16 | For Sale | $74,500 | -- | $66 / Sq Ft |
| Year | Tax Paid | Tax Assessment Tax Assessment Total Assessment is a certain percentage of the fair market value that is determined by local assessors to be the total taxable value of land and additions on the property. | Land | Improvement |
|---|---|---|---|---|
| 2025 | $1,401 | $15,109 | $2,200 | $12,909 |
| 2024 | $1,401 | $14,390 | $2,200 | $12,190 |
| 2023 | $1,401 | $13,704 | $2,200 | $11,504 |
| 2022 | $1,287 | $13,704 | $2,200 | $11,504 |
| 2021 | $1,312 | $13,640 | $1,835 | $11,805 |
| 2020 | $588 | $6,119 | $776 | $5,343 |
| 2019 | $528 | $5,827 | $689 | $5,138 |
| 2018 | $499 | $5,550 | $837 | $4,713 |
| 2017 | $472 | $5,286 | $710 | $4,576 |
| 2016 | $363 | $5,034 | $540 | $4,494 |
| 2015 | $350 | $4,906 | $1,078 | $3,828 |
| 2014 | $350 | $4,906 | $1,078 | $3,828 |
S
Seller's Agent in 2016
Sherry Sullivan
Inactive Office
Source: MLS Technology
MLS Number: 1722724
APN: A155-00-009-001-0-000-00
Disclaimer: Certain information contained herein is derived from information provided by parties other than Homes.com. All information provided is deemed reliable, but is not guaranteed to be accurate and should be independently verified.
![]() IDX information is provided exclusively for personal, non-commercial use, and may not be used for any purpose other than to identify prospective properties consumers may be interested in purchasing.
IDX information is provided exclusively for personal, non-commercial use, and may not be used for any purpose other than to identify prospective properties consumers may be interested in purchasing.
Information is deemed reliable but not guaranteed.