1811 Huntington Rd Waterloo, IA 50701
Estimated Value: $140,135 - $155,000
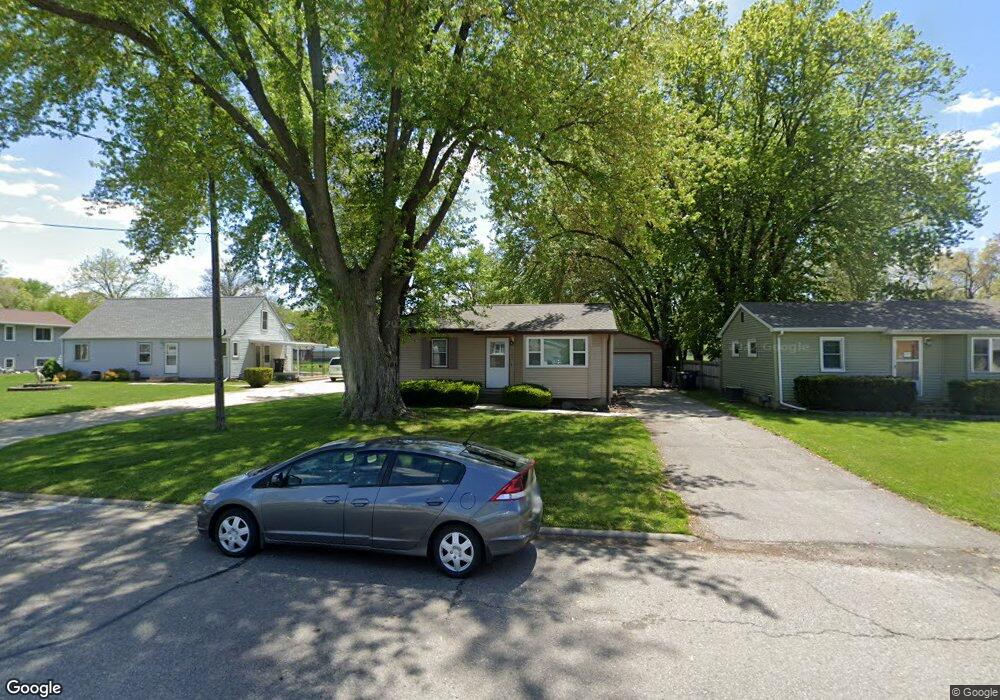
About This Home
This house is in a really peaceful neighborhood. It's perfect for someone who wants a quiet place, close to dog park and bike trails. And the backyard is great for pets - plenty of fenced space for them to run around. Close to West High, Central middle school, Becker Elementary (renter pays utilities and does lawn care and snow removal, cable ready, no laundry but there are hookups, $250 non-refundable pet deposit)
Other Requirements: referral from last home, Background check (for a history of evictions), First and last month's rent (in the form of deposit), ID, proof of income, and rental application (provided at showing).
Email to set up a showing.
Please request to fill out an online rental application if interested:
Ownership History
Purchase Details
Home Financials for this Owner
Home Financials are based on the most recent Mortgage that was taken out on this home.Home Values in the Area
Average Home Value in this Area
Purchase History
| Date | Buyer | Sale Price | Title Company |
|---|---|---|---|
| Mckinley Heidi K | $77,500 | Title Services Corporation |
Mortgage History
| Date | Status | Borrower | Loan Amount |
|---|---|---|---|
| Open | Mckinley Heidi K | $69,750 |
Property History
| Date | Event | Price | List to Sale | Price per Sq Ft |
|---|---|---|---|---|
| 11/08/2024 11/08/24 | Off Market | $1,100 | -- | -- |
| 10/28/2024 10/28/24 | For Rent | $1,100 | -- | -- |
Tax History Compared to Growth
Tax History
| Year | Tax Paid | Tax Assessment Tax Assessment Total Assessment is a certain percentage of the fair market value that is determined by local assessors to be the total taxable value of land and additions on the property. | Land | Improvement |
|---|---|---|---|---|
| 2025 | $2,418 | $124,140 | $18,850 | $105,290 |
| 2024 | $2,418 | $111,450 | $18,850 | $92,600 |
| 2023 | $2,046 | $111,450 | $18,850 | $92,600 |
| 2022 | $2,066 | $93,150 | $18,850 | $74,300 |
| 2021 | $2,124 | $96,670 | $18,850 | $77,820 |
| 2020 | $2,090 | $93,770 | $15,950 | $77,820 |
| 2019 | $2,090 | $93,770 | $15,950 | $77,820 |
| 2018 | $2,213 | $93,770 | $15,950 | $77,820 |
| 2017 | $2,064 | $93,770 | $15,950 | $77,820 |
| 2016 | $2,040 | $89,880 | $15,950 | $73,930 |
| 2015 | $2,040 | $89,880 | $15,950 | $73,930 |
| 2014 | $2,078 | $89,880 | $15,950 | $73,930 |
Map
- 1726 Huntington Rd
- 1269 Scott Ave
- 1507 Downing Ave
- 1275 Deloris Dr
- 1742 Sager Ave
- 1114 Eleanor Dr
- 1225 Downing Ave
- 1221 Downing Ave
- 1111 Scott Ave
- 2621 University Ave
- 915 Alabar Ave
- 3816 Monterey Dr
- 3913 Onawa Dr
- 819 Hanna Blvd
- 102 Bergen Dr
- 104 Bergen Dr
- 1137 Fleur Dr
- 2320 University Ave
- 241 Carrington Ave
- 814 Heartland Hills Dr
- 1803 Huntington Rd
- 1819 Huntington Rd
- 1829 Huntington Rd
- 1755 Huntington Rd
- 1835 Huntington Rd
- 1814 Robin Rd
- 1752 Robin Rd
- 1804 Robin Rd
- 1818 Huntington Rd
- 1824 Huntington Rd
- 1745 Huntington Rd
- 1828 Huntington Rd
- 1810 Huntington Rd
- 1802 Huntington Rd
- 1834 Huntington Rd
- 1839 Huntington Rd
- 1840 Huntington Rd
- 1826 Robin Rd
- 1737 Huntington Rd
- 1750 Huntington Rd