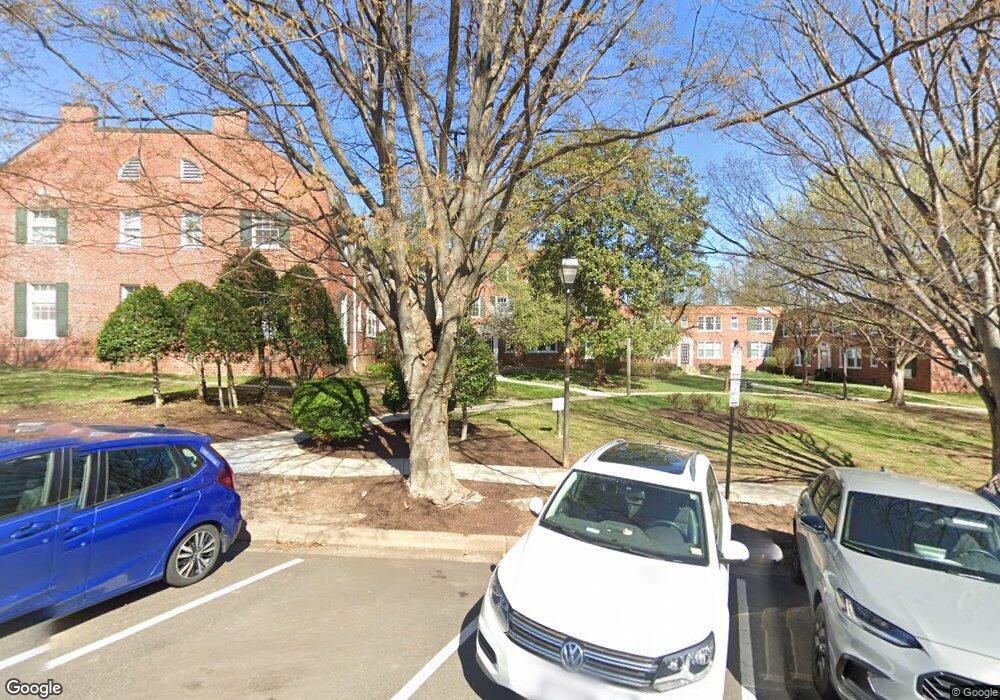
1811 Key Blvd Unit 10534 Arlington, VA 22201
Colonial Village NeighborhoodEstimated Value: $316,829 - $437,000
1
Bed
1
Bath
608
Sq Ft
$573/Sq Ft
Est. Value
About This Home
This home is located at 1811 Key Blvd Unit 10534, Arlington, VA 22201 and is currently estimated at $348,457, approximately $573 per square foot. 1811 Key Blvd Unit 10534 is a home located in Arlington County with nearby schools including Francis Scott Key Elementary School, Dorothy Hamm Middle School, and Yorktown High School.
Ownership History
Date
Name
Owned For
Owner Type
Purchase Details
Closed on
Sep 30, 2009
Sold by
Beauvais Amy H
Bought by
Brattland Janel Kaye
Current Estimated Value
Home Financials for this Owner
Home Financials are based on the most recent Mortgage that was taken out on this home.
Original Mortgage
$259,200
Outstanding Balance
$169,599
Interest Rate
5.12%
Mortgage Type
New Conventional
Estimated Equity
$178,858
Purchase Details
Closed on
Jun 27, 2006
Sold by
Erwin Adela
Bought by
Beauvais Amy
Home Financials for this Owner
Home Financials are based on the most recent Mortgage that was taken out on this home.
Original Mortgage
$244,000
Interest Rate
6.58%
Mortgage Type
New Conventional
Purchase Details
Closed on
Jun 27, 1994
Sold by
Shepherd L A
Bought by
Erwin Lydia A
Home Financials for this Owner
Home Financials are based on the most recent Mortgage that was taken out on this home.
Original Mortgage
$80,750
Interest Rate
8.74%
Create a Home Valuation Report for This Property
The Home Valuation Report is an in-depth analysis detailing your home's value as well as a comparison with similar homes in the area
Home Values in the Area
Average Home Value in this Area
Purchase History
| Date | Buyer | Sale Price | Title Company |
|---|---|---|---|
| Brattland Janel Kaye | $288,000 | -- | |
| Beauvais Amy | $305,000 | -- | |
| Erwin Lydia A | $85,000 | -- |
Source: Public Records
Mortgage History
| Date | Status | Borrower | Loan Amount |
|---|---|---|---|
| Open | Brattland Janel Kaye | $259,200 | |
| Previous Owner | Beauvais Amy | $244,000 | |
| Previous Owner | Beauvais Amy | $61,000 | |
| Previous Owner | Erwin Lydia A | $80,750 |
Source: Public Records
Tax History Compared to Growth
Tax History
| Year | Tax Paid | Tax Assessment Tax Assessment Total Assessment is a certain percentage of the fair market value that is determined by local assessors to be the total taxable value of land and additions on the property. | Land | Improvement |
|---|---|---|---|---|
| 2025 | $3,169 | $306,800 | $46,800 | $260,000 |
| 2024 | $3,066 | $296,800 | $46,800 | $250,000 |
| 2023 | $2,929 | $284,400 | $46,800 | $237,600 |
| 2022 | $2,986 | $289,900 | $46,800 | $243,100 |
| 2021 | $2,986 | $289,900 | $46,800 | $243,100 |
| 2020 | $2,836 | $276,400 | $26,100 | $250,300 |
| 2019 | $2,798 | $272,700 | $26,100 | $246,600 |
| 2018 | $2,724 | $272,700 | $26,100 | $246,600 |
| 2017 | $2,689 | $267,300 | $26,100 | $241,200 |
| 2016 | $2,704 | $272,900 | $26,100 | $246,800 |
| 2015 | $2,698 | $270,900 | $26,100 | $244,800 |
| 2014 | $2,609 | $261,900 | $26,100 | $235,800 |
Source: Public Records
Map
Nearby Homes
- 1802 Key Blvd Unit 9482
- 2021 Key Blvd Unit 12618
- 2100 Langston Blvd Unit 431
- 2100 Langston Blvd Unit 112
- 2100 Langston Blvd Unit 320
- 2100 Langston Blvd Unit 406
- 1909 N Rhodes St Unit 25
- 1909 N Rhodes St Unit 30
- 1723 N Troy St Unit 8405
- 1817 N Rhodes St Unit 4260
- 1712 N Veitch St
- 1800 Wilson Blvd Unit 206
- 1800 Wilson Blvd Unit 449
- 1800 Wilson Blvd Unit 335
- 2000 Clarendon Blvd Unit 307
- 2001 15th St N Unit 1210
- 2001 15th St N Unit 111
- 2001 15th St N Unit 306
- 2001 15th St N Unit 420
- 2001 15th St N Unit 506
- 1811 Key Blvd Unit 531
- 1811 Key Blvd Unit 10529
- 1811 Key Blvd Unit 10525
- 1811 Key Blvd Unit 10528
- 1811 Key Blvd Unit 10524
- 1811 Key Blvd Unit 10533
- 1811 Key Blvd Unit 10532
- 1811 Key Blvd Unit 10531
- 1811 Key Blvd Unit 10530
- 1811 Key Blvd Unit 10527
- 1811 Key Blvd Unit 10526
- 1811 Key Blvd Unit 10523
- 1811 Key Blvd Unit 529
- 1811 Key Blvd Unit 534
- 1811 Key Blvd Unit 525
- 1811 Key Blvd Unit 530
- 1811 Key Blvd
- 1811 Key Blvd Unit 532
- 1807 Key Blvd Unit 10521
- 1807 Key Blvd Unit 10522