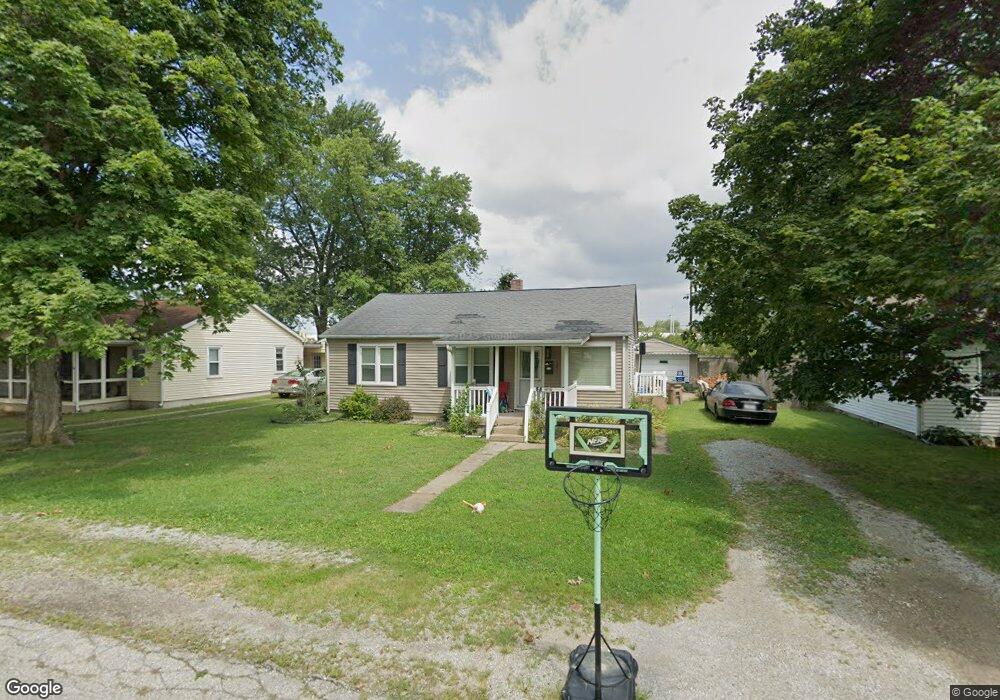
1811 Lee St Columbus, IN 47201
Estimated Value: $176,993 - $196,000
3
Beds
1
Bath
1,008
Sq Ft
$182/Sq Ft
Est. Value
About This Home
This home is located at 1811 Lee St, Columbus, IN 47201 and is currently estimated at $183,748, approximately $182 per square foot. 1811 Lee St is a home located in Bartholomew County with nearby schools including L.F. Smith Elementary School, Central Middle School, and Columbus East High School.
Ownership History
Date
Name
Owned For
Owner Type
Purchase Details
Closed on
Jan 26, 2015
Sold by
Cregg Heidi
Bought by
Boyd Jacob A and Weekly Mikayla D
Current Estimated Value
Purchase Details
Closed on
Feb 26, 2010
Sold by
Watson Brittney M
Bought by
Heidi Cregg
Purchase Details
Closed on
Jul 31, 2007
Sold by
Matheny Michael R
Bought by
Watson Brittney M
Purchase Details
Closed on
Aug 3, 2005
Sold by
Clark Richard M
Bought by
Jones Kimberly D
Create a Home Valuation Report for This Property
The Home Valuation Report is an in-depth analysis detailing your home's value as well as a comparison with similar homes in the area
Home Values in the Area
Average Home Value in this Area
Purchase History
| Date | Buyer | Sale Price | Title Company |
|---|---|---|---|
| Boyd Jacob A | $89,000 | Fidelity National Title | |
| Boyd Jacob A | -- | Attorney | |
| Heidi Cregg | $86,000 | -- | |
| Cregg Heidi | $86,000 | -- | |
| Watson Brittney M | -- | Attorney | |
| Jones Kimberly D | -- | Attorney |
Source: Public Records
Tax History Compared to Growth
Tax History
| Year | Tax Paid | Tax Assessment Tax Assessment Total Assessment is a certain percentage of the fair market value that is determined by local assessors to be the total taxable value of land and additions on the property. | Land | Improvement |
|---|---|---|---|---|
| 2024 | $954 | $108,000 | $26,000 | $82,000 |
| 2023 | $906 | $105,700 | $26,000 | $79,700 |
| 2022 | $908 | $103,300 | $26,000 | $77,300 |
| 2021 | $921 | $102,900 | $19,400 | $83,500 |
| 2020 | $551 | $80,700 | $19,400 | $61,300 |
| 2019 | $516 | $80,700 | $19,400 | $61,300 |
| 2018 | $463 | $77,700 | $19,400 | $58,300 |
| 2017 | $464 | $77,500 | $18,500 | $59,000 |
| 2016 | $437 | $76,500 | $18,500 | $58,000 |
| 2014 | $489 | $79,000 | $18,500 | $60,500 |
| 2013 | $489 | $79,000 | $18,500 | $60,500 |
Source: Public Records
Map
Nearby Homes