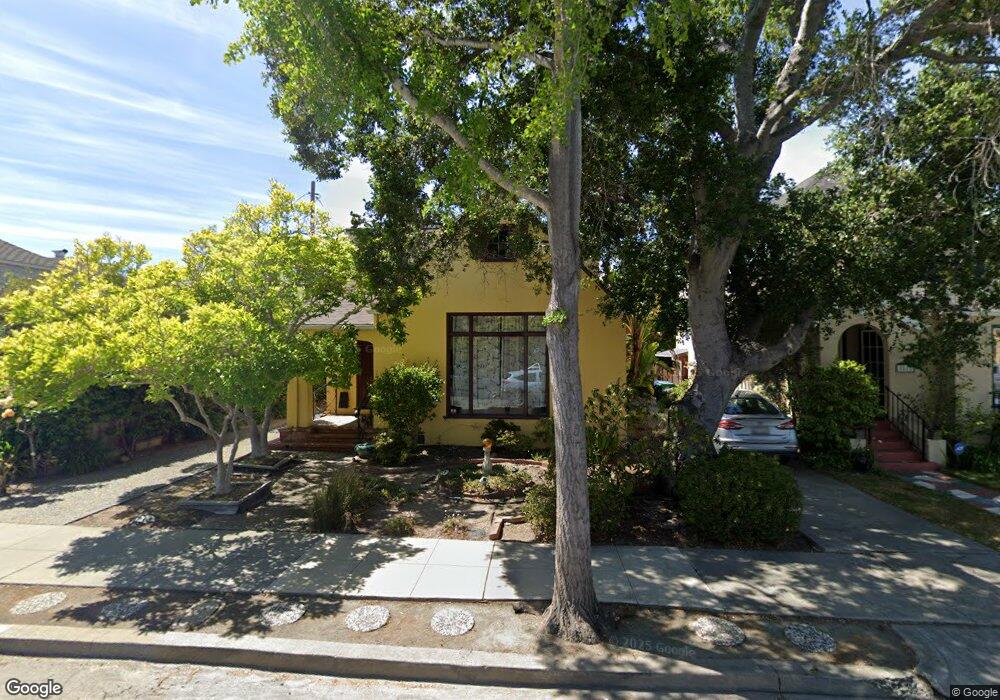
1811 Moreland Dr Alameda, CA 94501
Downtown Alameda NeighborhoodEstimated Value: $1,199,395 - $1,625,000
5
Beds
3
Baths
2,426
Sq Ft
$593/Sq Ft
Est. Value
About This Home
This home is located at 1811 Moreland Dr, Alameda, CA 94501 and is currently estimated at $1,438,099, approximately $592 per square foot. 1811 Moreland Dr is a home located in Alameda County with nearby schools including Edison Elementary School, Lincoln Middle School, and Alameda High School.
Ownership History
Date
Name
Owned For
Owner Type
Purchase Details
Closed on
Sep 16, 2022
Sold by
Carey Kristine B
Bought by
Sands Justin and Brownson Sally
Current Estimated Value
Home Financials for this Owner
Home Financials are based on the most recent Mortgage that was taken out on this home.
Original Mortgage
$750,000
Outstanding Balance
$716,364
Interest Rate
5.22%
Mortgage Type
New Conventional
Estimated Equity
$721,735
Purchase Details
Closed on
Sep 15, 2022
Sold by
Brownson Rebecca
Bought by
Brownson Donald E
Home Financials for this Owner
Home Financials are based on the most recent Mortgage that was taken out on this home.
Original Mortgage
$750,000
Outstanding Balance
$716,364
Interest Rate
5.22%
Mortgage Type
New Conventional
Estimated Equity
$721,735
Purchase Details
Closed on
Mar 5, 2018
Sold by
Brownson Kevis and Brownson Kevis B
Bought by
Revocabl Brownson Kevis B and Revocabl Kevis B Brownson 2007
Purchase Details
Closed on
Feb 26, 2018
Sold by
Carey Kristine B and Carey Howard
Bought by
Carey Kristine B and Brownson Donald E
Create a Home Valuation Report for This Property
The Home Valuation Report is an in-depth analysis detailing your home's value as well as a comparison with similar homes in the area
Home Values in the Area
Average Home Value in this Area
Purchase History
| Date | Buyer | Sale Price | Title Company |
|---|---|---|---|
| Sands Justin | $847,000 | First American Title | |
| Brownson Donald E | -- | First American Title | |
| Revocabl Brownson Kevis B | -- | None Available | |
| Carey Kristine B | -- | None Available |
Source: Public Records
Mortgage History
| Date | Status | Borrower | Loan Amount |
|---|---|---|---|
| Open | Sands Justin | $750,000 |
Source: Public Records
Tax History Compared to Growth
Tax History
| Year | Tax Paid | Tax Assessment Tax Assessment Total Assessment is a certain percentage of the fair market value that is determined by local assessors to be the total taxable value of land and additions on the property. | Land | Improvement |
|---|---|---|---|---|
| 2025 | $14,609 | $1,011,202 | $315,105 | $703,097 |
| 2024 | $14,609 | $991,238 | $308,927 | $689,311 |
| 2023 | $14,138 | $978,664 | $302,869 | $675,795 |
| 2022 | $4,057 | $126,205 | $67,230 | $65,975 |
| 2021 | $3,994 | $123,592 | $65,911 | $64,681 |
| 2020 | $3,958 | $129,254 | $65,236 | $64,018 |
| 2019 | $3,216 | $126,720 | $63,957 | $62,763 |
| 2018 | $3,158 | $124,236 | $62,703 | $61,533 |
| 2017 | $3,069 | $121,799 | $61,473 | $60,326 |
| 2016 | $3,049 | $119,412 | $60,268 | $59,144 |
| 2015 | $3,032 | $117,618 | $59,363 | $58,255 |
| 2014 | $2,951 | $115,314 | $58,200 | $57,114 |
Source: Public Records
Map
Nearby Homes
- 1818 Fremont Dr
- 1831 Harvard Dr
- 3029 Thompson Ave
- 1601 Broadway Unit 9
- 2853 Regatta Dr Unit 179
- 2022 High St Unit A
- 3114 Thompson Ave
- 303 Bowsman Ct Unit 144
- 340 29th Ave Unit 207
- 340 29th Ave Unit 204
- 3103 Central Ave
- 3242 Garfield Ave
- 2310 Pacific Ave
- 3246 Garfield Ave
- 2620 Encinal Ave
- 1238 Versailles Ave
- 1611 Lea Ct
- 2754 E 7th St
- 2417 Marti Rae Ct
- 3957 Wattling St
- 1815 Moreland Dr
- 2811 Yosemite Ave
- 1803 Moreland Dr
- 1819 Moreland Dr
- 2809 Yosemite Ave
- 1810 Versailles Ave
- 1814 Versailles Ave
- 2805 Yosemite Ave
- 1823 Moreland Dr
- 1818 Versailles Ave
- 2821 Yosemite Ave
- 1800 Versailles Ave
- 1810 Moreland Dr
- 1822 Versailles Ave
- 1814 Moreland Dr
- 1818 Moreland Dr
- 2825 Yosemite Ave
- 1826 Versailles Ave
- 1822 Moreland Dr
- 1737 Moreland Dr