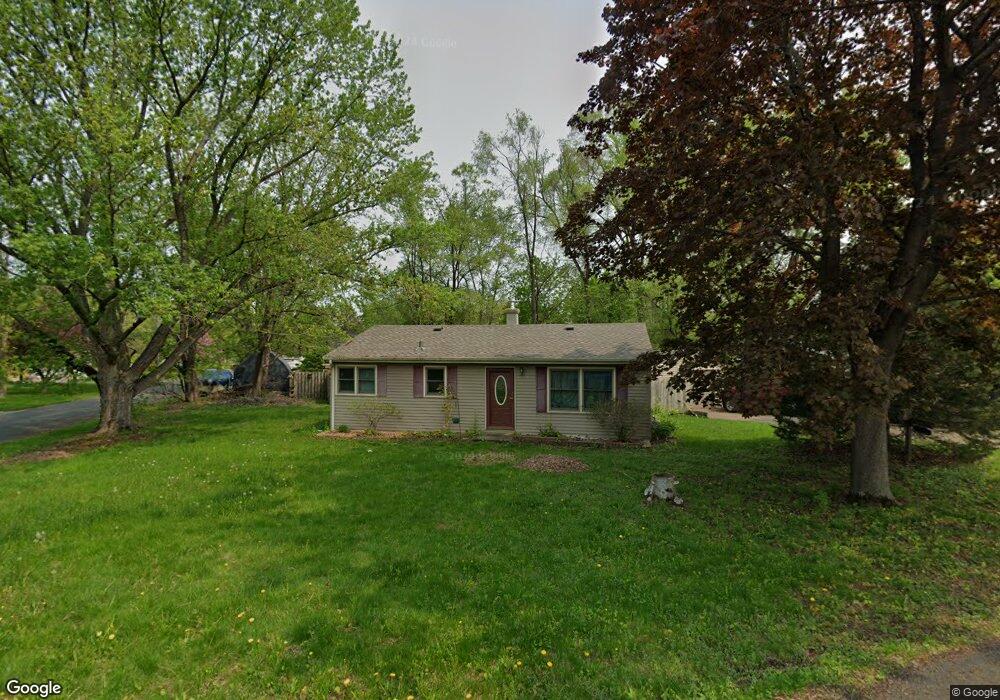
1811 Quello Ave S Lakeland, MN 55043
Estimated Value: $240,000 - $261,000
2
Beds
1
Bath
864
Sq Ft
$293/Sq Ft
Est. Value
About This Home
This home is located at 1811 Quello Ave S, Lakeland, MN 55043 and is currently estimated at $253,143, approximately $292 per square foot. 1811 Quello Ave S is a home located in Washington County with nearby schools including Afton-Lakeland Elementary School, Oak-Land Middle School, and Stillwater Area High School.
Ownership History
Date
Name
Owned For
Owner Type
Purchase Details
Closed on
Jun 24, 2015
Sold by
Regnier Ricky J
Bought by
Lebeis Matthew D
Current Estimated Value
Home Financials for this Owner
Home Financials are based on the most recent Mortgage that was taken out on this home.
Original Mortgage
$147,184
Outstanding Balance
$116,579
Interest Rate
4.4%
Mortgage Type
FHA
Estimated Equity
$136,564
Purchase Details
Closed on
Feb 24, 2012
Sold by
Bethke Robert C and Bethke Virginia
Bought by
Regnier Ricky J
Home Financials for this Owner
Home Financials are based on the most recent Mortgage that was taken out on this home.
Original Mortgage
$123,292
Interest Rate
3.75%
Mortgage Type
FHA
Purchase Details
Closed on
May 4, 2001
Sold by
Drinkwind Kathleen T
Bought by
Bethke Robert C
Purchase Details
Closed on
Oct 21, 1999
Sold by
Zigan Odean K
Bought by
Drinkwine Kathleen T
Create a Home Valuation Report for This Property
The Home Valuation Report is an in-depth analysis detailing your home's value as well as a comparison with similar homes in the area
Home Values in the Area
Average Home Value in this Area
Purchase History
| Date | Buyer | Sale Price | Title Company |
|---|---|---|---|
| Lebeis Matthew D | $149,900 | Burnet Title | |
| Regnier Ricky J | $126,500 | Title Recording Services Inc | |
| Bethke Robert C | $133,900 | -- | |
| Drinkwine Kathleen T | $113,900 | -- |
Source: Public Records
Mortgage History
| Date | Status | Borrower | Loan Amount |
|---|---|---|---|
| Open | Lebeis Matthew D | $147,184 | |
| Previous Owner | Regnier Ricky J | $123,292 |
Source: Public Records
Tax History Compared to Growth
Tax History
| Year | Tax Paid | Tax Assessment Tax Assessment Total Assessment is a certain percentage of the fair market value that is determined by local assessors to be the total taxable value of land and additions on the property. | Land | Improvement |
|---|---|---|---|---|
| 2024 | $1,832 | $219,200 | $95,000 | $124,200 |
| 2023 | $1,832 | $247,100 | $130,000 | $117,100 |
| 2022 | $2,436 | $222,800 | $117,500 | $105,300 |
| 2021 | $1,764 | $189,600 | $100,000 | $89,600 |
| 2020 | $1,708 | $185,300 | $100,000 | $85,300 |
| 2019 | $1,640 | $178,700 | $95,000 | $83,700 |
| 2018 | $1,438 | $165,100 | $83,800 | $81,300 |
| 2017 | $1,478 | $141,100 | $67,000 | $74,100 |
| 2016 | $1,334 | $142,000 | $67,000 | $75,000 |
| 2015 | $1,282 | $100,100 | $43,700 | $56,400 |
| 2013 | -- | $106,700 | $44,500 | $62,200 |
Source: Public Records
Map
Nearby Homes
- 1850 Quasar Ave S
- 1615 Quasar Ct S
- 1880 Riviera Ave S
- 1425 Quasar Ct S
- 16460 Upper 22nd St S
- 308 N Cove Rd
- 294 Cove Rd
- 24x Cove Rd
- 15800 33rd St S
- 3343 Saint Croix Trail S
- 131 Quality Ave S
- 15955 35th St S
- 15945 35th St S
- 180 Saint Croix Trail N
- 326 S Cove Rd
- 16178 1st St N
- 235 Quehl Ave N
- 264 Saint Annes Pkwy
- 316 Saint Annes Pkwy
- 266 Troon Ct
- 1811 1811 Quello Ave S
- 1810 Quentin Ave S
- 16566 18th St S
- 1840 Quentin Ave S
- 16544 16544 18th St S
- 1813 1813 Quentin-Avenue-s
- 1813 1813 Quentin Ave S
- 16545 18th St S
- 1845 1845 Quello-Avenue-s
- 1845 Quello Ave S
- 1780 Quentin Ave S
- 16544 18th St S
- 1813 Quentin Ave S
- 1815 Queens Ave S
- 1835 Queens Ave S
- 1860 Quentin Ave S
- 1835 Quentin Ave S
- 1880 Quello Ave S
- 1845 Queens Ave S
- 16630 18th St S