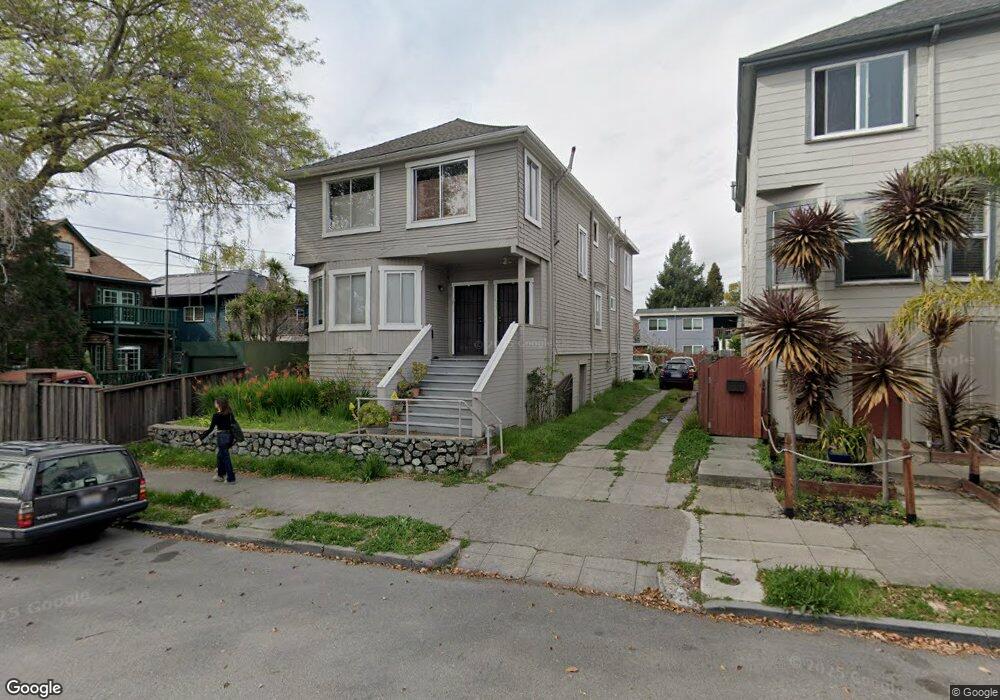
1811 Woolsey St Berkeley, CA 94703
South Berkeley NeighborhoodEstimated Value: $1,176,000 - $2,327,000
Studio
--
Bath
2,629
Sq Ft
$572/Sq Ft
Est. Value
About This Home
This home is located at 1811 Woolsey St, Berkeley, CA 94703 and is currently estimated at $1,505,030, approximately $572 per square foot. 1811 Woolsey St is a home located in Alameda County with nearby schools including Malcolm X Elementary School, Emerson Elementary School, and John Muir Elementary School.
Ownership History
Date
Name
Owned For
Owner Type
Purchase Details
Closed on
May 25, 2007
Sold by
Wallach Andrew B and Wallach Nancy
Bought by
Wallach Andrew B and Wallach Nancy
Current Estimated Value
Purchase Details
Closed on
Jul 6, 2004
Sold by
Wallach Andrew B and Wallach Andrew
Bought by
Wallach Andrew B and Wallach Nancy
Home Financials for this Owner
Home Financials are based on the most recent Mortgage that was taken out on this home.
Original Mortgage
$297,000
Interest Rate
3.29%
Mortgage Type
New Conventional
Create a Home Valuation Report for This Property
The Home Valuation Report is an in-depth analysis detailing your home's value as well as a comparison with similar homes in the area
Home Values in the Area
Average Home Value in this Area
Purchase History
| Date | Buyer | Sale Price | Title Company |
|---|---|---|---|
| Wallach Andrew B | -- | None Available | |
| Wallach Andrew B | -- | Ticor Title Company Of Ca |
Source: Public Records
Mortgage History
| Date | Status | Borrower | Loan Amount |
|---|---|---|---|
| Closed | Wallach Andrew B | $297,000 |
Source: Public Records
Tax History
| Year | Tax Paid | Tax Assessment Tax Assessment Total Assessment is a certain percentage of the fair market value that is determined by local assessors to be the total taxable value of land and additions on the property. | Land | Improvement |
|---|---|---|---|---|
| 2025 | $9,240 | $206,823 | $138,245 | $68,578 |
| 2024 | $9,240 | $202,769 | $135,535 | $67,234 |
| 2023 | $8,945 | $198,793 | $132,878 | $65,915 |
| 2022 | $8,817 | $194,895 | $130,272 | $64,623 |
| 2021 | $8,757 | $191,074 | $127,718 | $63,356 |
| 2020 | $8,013 | $189,116 | $126,409 | $62,707 |
| 2019 | $6,619 | $185,408 | $123,931 | $61,477 |
| 2018 | $8,172 | $181,773 | $121,501 | $60,272 |
| 2017 | $7,868 | $178,209 | $119,119 | $59,090 |
| 2016 | $7,380 | $174,716 | $116,784 | $57,932 |
| 2015 | $7,218 | $172,092 | $115,030 | $57,062 |
| 2014 | $7,127 | $168,721 | $112,777 | $55,944 |
Source: Public Records
Map
Nearby Homes
- 3233 Ellis St
- 2926 Ellis St
- 3114 California St
- 3110 California St
- 3138 California St
- 3214 California St
- 1507 Prince St
- 2045 Emerson St
- 6555 Shattuck Ave
- 2057 Emerson St
- 1535 Julia St
- 3224 Sacramento St
- 1610 Oregon St
- 2124 Prince St
- 6300 Shattuck Ave Unit 1
- 2110 Ashby Ave
- 667 & 667A Alcatraz Ave
- 667 Alcatraz Ave
- 6015 Adeline St
- 629 66th St
Your Personal Tour Guide
Ask me questions while you tour the home.