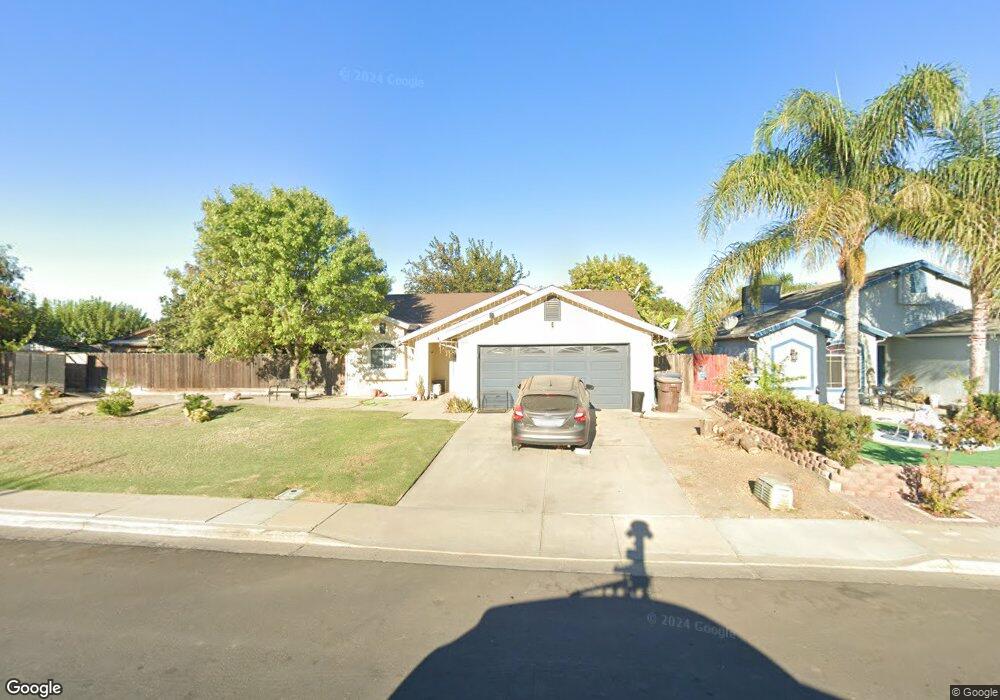
1811 Zozaya St Firebaugh, CA 93622
Estimated Value: $316,000 - $372,000
4
Beds
2
Baths
1,486
Sq Ft
$231/Sq Ft
Est. Value
About This Home
This home is located at 1811 Zozaya St, Firebaugh, CA 93622 and is currently estimated at $343,594, approximately $231 per square foot. 1811 Zozaya St is a home located in Fresno County with nearby schools including Arthur E. Mills Intermediate School, Hazel M. Bailey Primary School, and Firebaugh Middle School.
Ownership History
Date
Name
Owned For
Owner Type
Purchase Details
Closed on
Feb 14, 2022
Sold by
Marin and Lourdes
Bought by
Marin Cesar and Marin Lourdes Cardenas
Current Estimated Value
Home Financials for this Owner
Home Financials are based on the most recent Mortgage that was taken out on this home.
Original Mortgage
$210,000
Outstanding Balance
$195,001
Interest Rate
3.55%
Mortgage Type
New Conventional
Estimated Equity
$148,593
Purchase Details
Closed on
Mar 8, 2006
Sold by
Marin Cesar
Bought by
Marin Cesar and Marin Lourdes
Home Financials for this Owner
Home Financials are based on the most recent Mortgage that was taken out on this home.
Original Mortgage
$99,500
Interest Rate
5.91%
Mortgage Type
Fannie Mae Freddie Mac
Purchase Details
Closed on
Jul 5, 1995
Sold by
Little Stone Creek Partners
Bought by
Marin Cesar
Home Financials for this Owner
Home Financials are based on the most recent Mortgage that was taken out on this home.
Original Mortgage
$88,446
Interest Rate
7.59%
Mortgage Type
FHA
Create a Home Valuation Report for This Property
The Home Valuation Report is an in-depth analysis detailing your home's value as well as a comparison with similar homes in the area
Home Values in the Area
Average Home Value in this Area
Purchase History
| Date | Buyer | Sale Price | Title Company |
|---|---|---|---|
| Marin Cesar | -- | Chicago Title | |
| Marin Cesar | -- | Chicago Title | |
| Marin Cesar | -- | First American Title | |
| Marin Cesar | $78,000 | Chicago Title Co |
Source: Public Records
Mortgage History
| Date | Status | Borrower | Loan Amount |
|---|---|---|---|
| Open | Marin Cesar | $210,000 | |
| Closed | Marin Cesar | $210,000 | |
| Previous Owner | Marin Cesar | $99,500 | |
| Previous Owner | Marin Cesar | $88,446 |
Source: Public Records
Tax History Compared to Growth
Tax History
| Year | Tax Paid | Tax Assessment Tax Assessment Total Assessment is a certain percentage of the fair market value that is determined by local assessors to be the total taxable value of land and additions on the property. | Land | Improvement |
|---|---|---|---|---|
| 2025 | $1,621 | $146,984 | $33,207 | $113,777 |
| 2023 | $1,612 | $141,278 | $31,918 | $109,360 |
| 2022 | $1,576 | $138,509 | $31,293 | $107,216 |
| 2021 | $1,550 | $135,794 | $30,680 | $105,114 |
| 2020 | $1,582 | $134,403 | $30,366 | $104,037 |
| 2019 | $1,567 | $131,769 | $29,771 | $101,998 |
| 2018 | $1,533 | $129,187 | $29,188 | $99,999 |
| 2017 | $1,498 | $126,655 | $28,616 | $98,039 |
| 2016 | $1,396 | $124,172 | $28,055 | $96,117 |
| 2015 | $1,416 | $122,308 | $27,634 | $94,674 |
| 2014 | $1,385 | $119,913 | $27,093 | $92,820 |
Source: Public Records
Map
Nearby Homes
- 0 Highway 33
- 2206 N St
- 1320 Q St
- 1522 O St
- 9684 N Dos Palos Rd
- 99600 Douglas Ave
- 11885 Road 9
- 0 California 33 Unit btwn. Dos Palos & Fi
- 14222 Hudson Ave
- 442 Naples St
- 630 S Kate St
- 436 Naples St
- 0 Oller St
- 1197 Pucheu St
- 1236 Oller St
- 12498 Avenue 14
- 0 Fairfax Ave
- 42876 Valeria Ave
- 43044 Valeria Ave
- 0 N Douglas Ave Unit 23223744