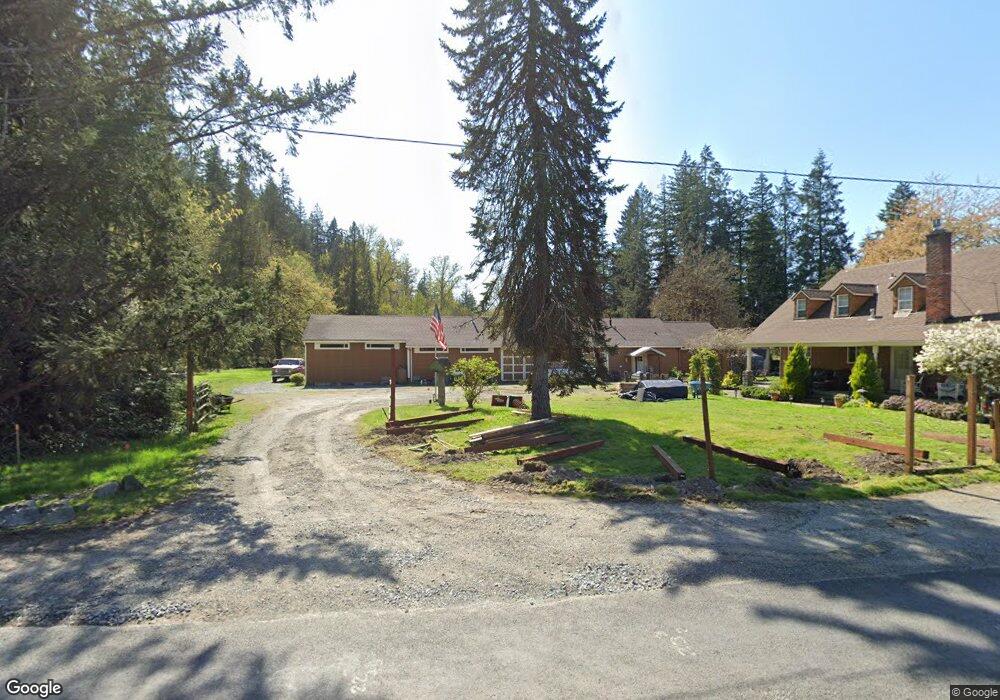
18111 Patterson Rd E Orting, WA 98360
Estimated Value: $519,000 - $687,000
3
Beds
1
Bath
1,672
Sq Ft
$346/Sq Ft
Est. Value
About This Home
This home is located at 18111 Patterson Rd E, Orting, WA 98360 and is currently estimated at $579,314, approximately $346 per square foot. 18111 Patterson Rd E is a home located in Pierce County with nearby schools including Orting Elementary School, Ptarmigan Ridge Elementary School, and Orting Middle School.
Ownership History
Date
Name
Owned For
Owner Type
Purchase Details
Closed on
Dec 28, 2023
Sold by
Van Loan Patrick S & Erin L
Bought by
Pierce Cnty
Current Estimated Value
Purchase Details
Closed on
May 25, 2018
Sold by
Brown Terri M
Bought by
Loan Patrick S Van and Loan Erin L Van
Home Financials for this Owner
Home Financials are based on the most recent Mortgage that was taken out on this home.
Original Mortgage
$293,400
Interest Rate
4.4%
Mortgage Type
New Conventional
Purchase Details
Closed on
Nov 20, 1995
Sold by
Painter Eva Marie and Wall Jack
Bought by
Brown Todd D and Brown Terri M
Home Financials for this Owner
Home Financials are based on the most recent Mortgage that was taken out on this home.
Original Mortgage
$100,000
Interest Rate
7.42%
Create a Home Valuation Report for This Property
The Home Valuation Report is an in-depth analysis detailing your home's value as well as a comparison with similar homes in the area
Purchase History
| Date | Buyer | Sale Price | Title Company |
|---|---|---|---|
| Pierce Cnty | -- | None Listed On Document | |
| Loan Patrick S Van | $325,719 | Fidelity National Title | |
| Brown Todd D | $115,000 | -- |
Source: Public Records
Mortgage History
| Date | Status | Borrower | Loan Amount |
|---|---|---|---|
| Previous Owner | Loan Patrick S Van | $293,400 | |
| Previous Owner | Brown Todd D | $100,000 |
Source: Public Records
Tax History
| Year | Tax Paid | Tax Assessment Tax Assessment Total Assessment is a certain percentage of the fair market value that is determined by local assessors to be the total taxable value of land and additions on the property. | Land | Improvement |
|---|---|---|---|---|
| 2025 | $4,173 | $414,700 | $134,400 | $280,300 |
| 2024 | $4,173 | $440,900 | $136,100 | $304,800 |
| 2023 | $4,173 | $411,400 | $127,700 | $283,700 |
| 2022 | $4,022 | $423,800 | $168,400 | $255,400 |
| 2021 | $3,596 | $290,300 | $106,000 | $184,300 |
| 2019 | $3,429 | $284,800 | $96,200 | $188,600 |
| 2018 | $3,453 | $261,200 | $88,000 | $173,200 |
| 2017 | $3,157 | $222,400 | $72,600 | $149,800 |
| 2016 | $2,941 | $179,000 | $45,300 | $133,700 |
| 2014 | $2,667 | $164,200 | $46,700 | $117,500 |
| 2013 | $2,667 | $144,600 | $40,700 | $103,900 |
Source: Public Records
Map
Nearby Homes
- 17612 219th Ave E
- 18920 217th Ave E
- 19510 190th Ave E
- 19713 196th Ave E
- 0 196th Ave E
- 19620 199th St E
- 18313 Patterson Rd E
- 16004 210th Ave E Unit 308
- 18406 229th Ave E
- 17011 226th Ave E
- 15814 210th Ave E
- 15814 210th Ave E Unit 310
- 15801 205th Avenue Ct E
- 15710 210th Ave E
- 15710 210th Ave E Unit 311
- 20524 165th St E
- 20532 165th St E
- 15706 210th Ave E Unit 312
- 15706 210th Ave E
- 15711 205th Avenue Ct E
- 18117 Patterson Rd E
- 18216 212th Ave E
- 20528 182nd St E
- 20505 182nd St E
- 18002 Patterson Rd E
- 20703 183rd St E
- 24806 182nd St E
- 25305 182nd St E Unit 98360
- 25305 182nd St E
- 18109 Patterson Rd E
- 20508 182nd St E
- 18520 182nd St E
- 17921 Pioneer Way E
- 20524 182nd St E
- 18211 212th Ave E
- 20619 183rd St E
- 17915 Pioneer Way E
- 17913 Pioneer Way E
- 18209 212th Ave E
- 18209 Pioneer Way E
Your Personal Tour Guide
Ask me questions while you tour the home.