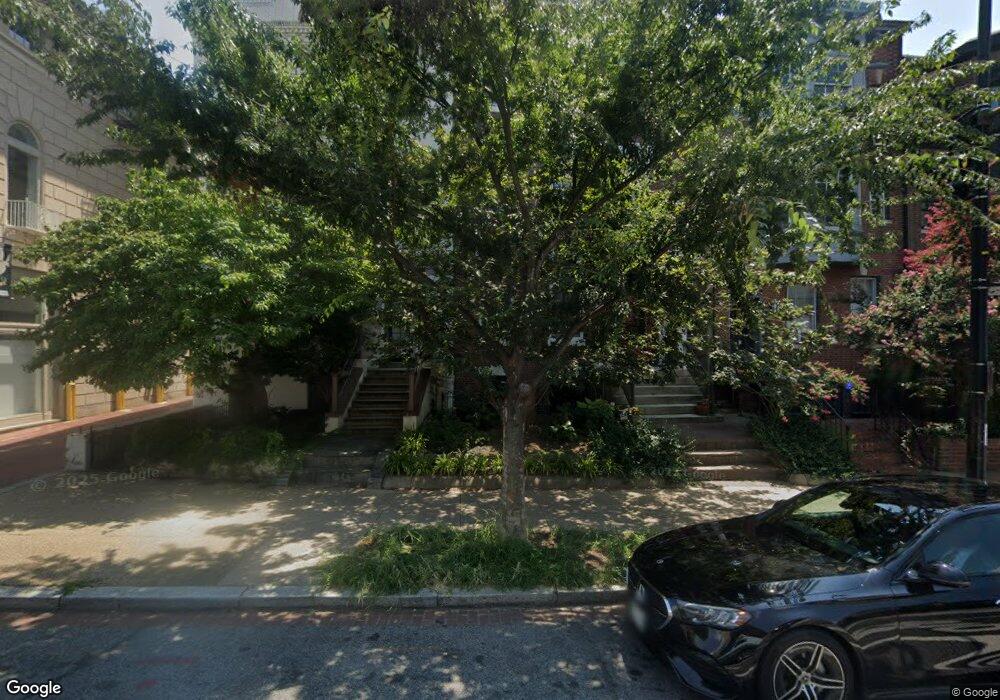
1812 Calvert St NW Unit A Washington, DC 20009
Kalorama Triangle NeighborhoodEstimated Value: $943,000 - $1,202,000
2
Beds
3
Baths
1,577
Sq Ft
$689/Sq Ft
Est. Value
About This Home
This home is located at 1812 Calvert St NW Unit A, Washington, DC 20009 and is currently estimated at $1,086,493, approximately $688 per square foot. 1812 Calvert St NW Unit A is a home located in District of Columbia with nearby schools including Oyster-Adams Bilingual School, Sequoia Union Elementary, and Jackson Reed High School.
Ownership History
Date
Name
Owned For
Owner Type
Purchase Details
Closed on
Aug 12, 2015
Sold by
Nezat Vivkie A
Bought by
Toumanlos John and Toumanlos Susan N
Current Estimated Value
Purchase Details
Closed on
Mar 16, 2007
Sold by
Holliday Chad H
Bought by
Naifeh Blair T
Home Financials for this Owner
Home Financials are based on the most recent Mortgage that was taken out on this home.
Original Mortgage
$500,000
Interest Rate
6.4%
Mortgage Type
New Conventional
Purchase Details
Closed on
Feb 13, 2004
Sold by
Husak Charles A
Bought by
Holliday Chad Hunter
Home Financials for this Owner
Home Financials are based on the most recent Mortgage that was taken out on this home.
Original Mortgage
$516,323
Interest Rate
5.62%
Mortgage Type
New Conventional
Create a Home Valuation Report for This Property
The Home Valuation Report is an in-depth analysis detailing your home's value as well as a comparison with similar homes in the area
Home Values in the Area
Average Home Value in this Area
Purchase History
| Date | Buyer | Sale Price | Title Company |
|---|---|---|---|
| Toumanlos John | $780,000 | None Available | |
| Naifeh Blair T | $625,000 | -- | |
| Holliday Chad Hunter | $504,000 | -- |
Source: Public Records
Mortgage History
| Date | Status | Borrower | Loan Amount |
|---|---|---|---|
| Previous Owner | Naifeh Blair T | $500,000 | |
| Previous Owner | Holliday Chad Hunter | $516,323 |
Source: Public Records
Tax History Compared to Growth
Tax History
| Year | Tax Paid | Tax Assessment Tax Assessment Total Assessment is a certain percentage of the fair market value that is determined by local assessors to be the total taxable value of land and additions on the property. | Land | Improvement |
|---|---|---|---|---|
| 2025 | $8,779 | $1,048,520 | $314,560 | $733,960 |
| 2024 | $8,624 | $1,029,820 | $308,950 | $720,870 |
| 2023 | $8,108 | $968,530 | $290,560 | $677,970 |
| 2022 | $8,641 | $1,030,390 | $309,120 | $721,270 |
| 2021 | $8,134 | $970,200 | $291,060 | $679,140 |
| 2020 | $7,711 | $907,150 | $272,140 | $635,010 |
| 2019 | $7,696 | $905,380 | $271,610 | $633,770 |
| 2018 | $7,504 | $882,790 | $0 | $0 |
| 2017 | $6,857 | $806,730 | $0 | $0 |
| 2016 | $6,663 | $783,870 | $0 | $0 |
| 2015 | $5,928 | $768,840 | $0 | $0 |
| 2014 | $5,897 | $763,960 | $0 | $0 |
Source: Public Records
Map
Nearby Homes
- 1841 Biltmore St NW Unit A
- 2611 Adams Mill Rd NW Unit 208
- 2627 Adams Mill Rd NW Unit 403
- 2516 Cliffbourne Place NW
- 1830 Columbia Rd NW
- 2465 18th St NW Unit 4
- 2465 18th St NW Unit 2
- 1855 Calvert St NW Unit 203
- 2630 Adams Mill Rd NW Unit 302
- 2707 Adams Mill Rd NW Unit 205
- 2707 Adams Mill Rd NW Unit 303
- 2707 Adams Mill Rd NW Unit 206
- 2707 Adams Mill Rd NW Unit 108
- 2380 Champlain St NW Unit 15 NOW 305 PENTHOUSE
- 1850 Ontario Place NW
- 1852 Columbia Rd NW Unit 101
- 2370 Champlain St NW Unit 34
- 2370 Champlain St NW Unit 12
- 1767 Lanier Place NW Unit 6
- 1851 Columbia Rd NW Unit 303
- 1812 Calvert St NW Unit B
- 1812 Calvert St NW Unit D
- 1812 Calvert St NW Unit C
- 1812 Calvert St NW Unit 1
- 1814 Calvert St NW
- 1820 Calvert St NW
- 1818 Calvert St NW
- 1818 Calvert St NW Unit 1818
- 1810 Calvert St NW Unit 2
- 1810 Calvert St NW
- 1810 Calvert St NW
- 1810 Calvert St NW
- 1810 Calvert St NW
- 1810 Calvert St NW
- 1810 Calvert St NW Unit 5
- 1810 Calvert St NW Unit 1
- 1810 Calvert St NW Unit 4
- 1822 Calvert St NW Unit 1
- 1822 Calvert St NW Unit 2
- 1822 Calvert St NW Unit 3