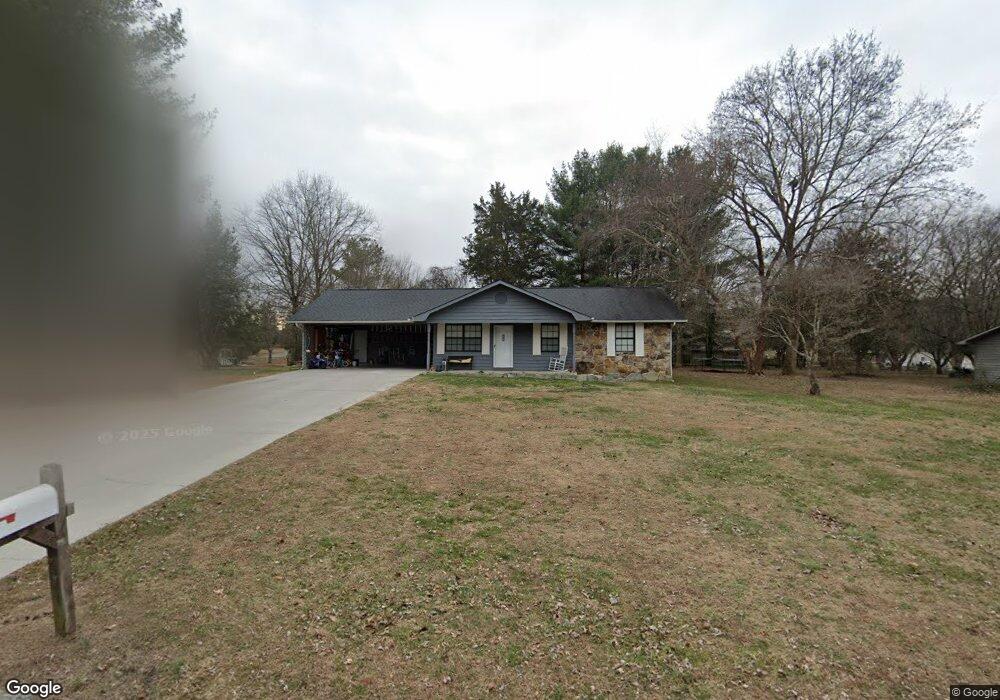
1812 Frankie Ln Sevierville, TN 37876
Estimated Value: $283,634 - $344,000
--
Bed
2
Baths
1,102
Sq Ft
$285/Sq Ft
Est. Value
About This Home
This home is located at 1812 Frankie Ln, Sevierville, TN 37876 and is currently estimated at $313,817, approximately $284 per square foot. 1812 Frankie Ln is a home located in Sevier County with nearby schools including Northview Elementary School, Catons Chapel Elementary School, and Jones Cove Elementary School.
Ownership History
Date
Name
Owned For
Owner Type
Purchase Details
Closed on
Sep 21, 2017
Sold by
Schoenfleld Jeffrey Mark
Bought by
Munasque Carla and Mattews Mckenzie L
Current Estimated Value
Home Financials for this Owner
Home Financials are based on the most recent Mortgage that was taken out on this home.
Original Mortgage
$136,363
Outstanding Balance
$113,873
Interest Rate
3.9%
Mortgage Type
New Conventional
Estimated Equity
$199,944
Purchase Details
Closed on
Mar 16, 2017
Sold by
Jpmorgan Chase Bank Nation
Bought by
Schoenfield Jeffrey Mark
Purchase Details
Closed on
Dec 14, 2016
Sold by
Martinez Jesse and Martinez Sally
Bought by
Jp Morgan Chase Bank Natl Assoc
Purchase Details
Closed on
Dec 21, 1995
Sold by
Street Martin D
Bought by
Jesse Martinez
Purchase Details
Closed on
Jun 29, 1993
Bought by
Street Martin D
Purchase Details
Closed on
Apr 29, 1988
Bought by
Urquhart Elizabeth
Create a Home Valuation Report for This Property
The Home Valuation Report is an in-depth analysis detailing your home's value as well as a comparison with similar homes in the area
Home Values in the Area
Average Home Value in this Area
Purchase History
| Date | Buyer | Sale Price | Title Company |
|---|---|---|---|
| Munasque Carla | $135,000 | Smoky Mountain Title | |
| Schoenfield Jeffrey Mark | $105,000 | -- | |
| Jp Morgan Chase Bank Natl Assoc | -- | -- | |
| Jpmorgan Chase Bank National A | $104,800 | -- | |
| Jesse Martinez | $78,500 | -- | |
| Street Martin D | $71,900 | -- | |
| Urquhart Elizabeth | $54,000 | -- |
Source: Public Records
Mortgage History
| Date | Status | Borrower | Loan Amount |
|---|---|---|---|
| Open | Munasque Carla | $136,363 |
Source: Public Records
Tax History Compared to Growth
Tax History
| Year | Tax Paid | Tax Assessment Tax Assessment Total Assessment is a certain percentage of the fair market value that is determined by local assessors to be the total taxable value of land and additions on the property. | Land | Improvement |
|---|---|---|---|---|
| 2025 | $571 | $38,575 | $10,000 | $28,575 |
| 2024 | $571 | $38,575 | $10,000 | $28,575 |
| 2023 | $571 | $38,575 | $0 | $0 |
| 2022 | $571 | $38,575 | $10,000 | $28,575 |
| 2021 | $571 | $38,575 | $10,000 | $28,575 |
| 2020 | $567 | $38,575 | $10,000 | $28,575 |
| 2019 | $567 | $30,500 | $10,000 | $20,500 |
| 2018 | $567 | $30,500 | $10,000 | $20,500 |
| 2017 | $567 | $30,500 | $10,000 | $20,500 |
| 2016 | $567 | $30,500 | $10,000 | $20,500 |
| 2015 | -- | $30,900 | $0 | $0 |
| 2014 | $504 | $30,912 | $0 | $0 |
Source: Public Records
Map
Nearby Homes
- 615 Dwight Ln
- 1262 Atchley Dr
- 2 Winfield Dunn Pkwy
- 1483 Catlettsburg Rd
- Lot 34 Winfield Dunn Pkwy
- Lot 2 Winfield Dunn Pkwy
- Lot 3 Winfield Dunn Pkwy
- 273 Cherokee Path Way
- 269 Cherokee Path Way
- 1114 Junaluska Way
- 894 Lake View Loop
- 898 Lake View Loop
- 1014 Walini Way
- 1010 Ravens Ford Way
- 1012 Ravens Ford Way
- 1005 Walini Way
- 1003 Walini Way
- 214 Tsali Way
- 206 S Smoky Mountain Way
- 1727 Norlil Rd