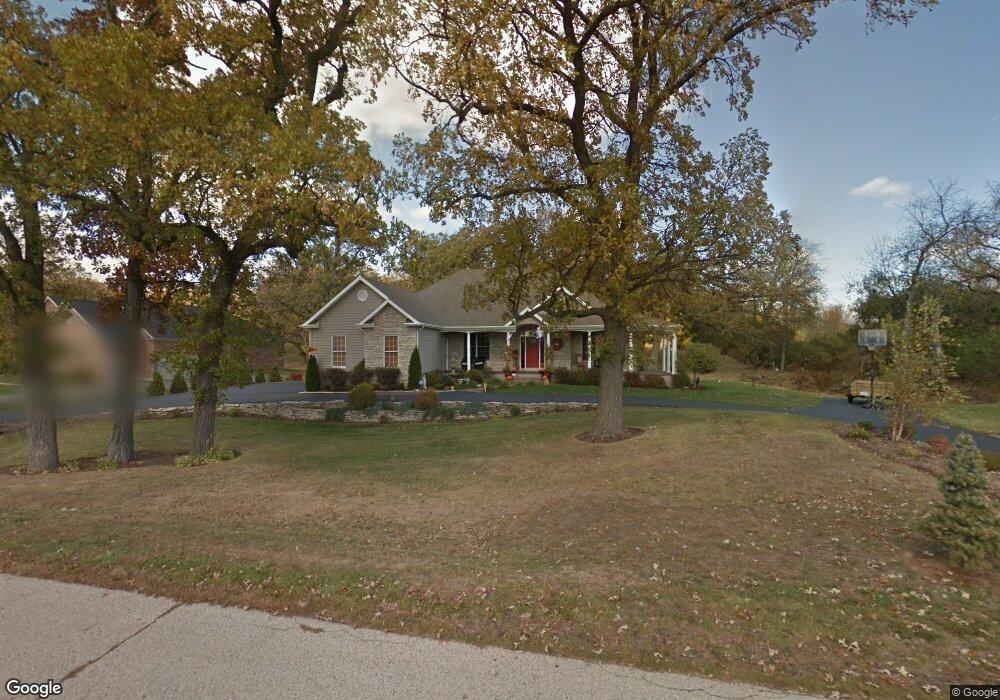
1812 Julia Way McHenry, IL 60051
Northwest Lakemoor NeighborhoodEstimated Value: $470,000 - $560,000
3
Beds
2
Baths
2,233
Sq Ft
$234/Sq Ft
Est. Value
About This Home
This home is located at 1812 Julia Way, McHenry, IL 60051 and is currently estimated at $523,426, approximately $234 per square foot. 1812 Julia Way is a home located in McHenry County with nearby schools including Hilltop Elementary School, Chauncey H Duker School, and Mchenry Middle School.
Ownership History
Date
Name
Owned For
Owner Type
Purchase Details
Closed on
Sep 26, 2008
Sold by
Wm Specialty Mortgage Llc
Bought by
Rico Jesus and Rico Leona L
Current Estimated Value
Home Financials for this Owner
Home Financials are based on the most recent Mortgage that was taken out on this home.
Original Mortgage
$248,000
Interest Rate
5.73%
Mortgage Type
Unknown
Purchase Details
Closed on
Jul 3, 2008
Sold by
Loitz David K and Loitz Kathryn E
Bought by
Wm Specialty Mortgage Llc
Purchase Details
Closed on
Aug 4, 2000
Sold by
Mcguire Jerry R and Mcguire Tori A
Bought by
Hanson Donald E
Home Financials for this Owner
Home Financials are based on the most recent Mortgage that was taken out on this home.
Original Mortgage
$120,000
Interest Rate
8.24%
Purchase Details
Closed on
Dec 12, 1997
Sold by
Mchenry State Bank
Bought by
Loitz David K
Create a Home Valuation Report for This Property
The Home Valuation Report is an in-depth analysis detailing your home's value as well as a comparison with similar homes in the area
Home Values in the Area
Average Home Value in this Area
Purchase History
| Date | Buyer | Sale Price | Title Company |
|---|---|---|---|
| Rico Jesus | $310,000 | None Available | |
| Wm Specialty Mortgage Llc | -- | None Available | |
| Hanson Donald E | $35,000 | Chicago Title | |
| Loitz David K | $77,000 | Stewart Title Company |
Source: Public Records
Mortgage History
| Date | Status | Borrower | Loan Amount |
|---|---|---|---|
| Closed | Rico Jesus | $248,000 | |
| Previous Owner | Hanson Donald E | $120,000 |
Source: Public Records
Tax History Compared to Growth
Tax History
| Year | Tax Paid | Tax Assessment Tax Assessment Total Assessment is a certain percentage of the fair market value that is determined by local assessors to be the total taxable value of land and additions on the property. | Land | Improvement |
|---|---|---|---|---|
| 2024 | $12,062 | $152,482 | $35,154 | $117,328 |
| 2023 | $11,670 | $136,608 | $31,494 | $105,114 |
| 2022 | $11,288 | $126,735 | $29,218 | $97,517 |
| 2021 | $11,036 | $121,172 | $27,210 | $93,962 |
| 2020 | $10,650 | $116,121 | $26,076 | $90,045 |
| 2019 | $10,507 | $110,266 | $24,761 | $85,505 |
| 2018 | $11,100 | $105,266 | $23,638 | $81,628 |
| 2017 | $11,148 | $102,949 | $22,185 | $80,764 |
| 2016 | $9,927 | $88,959 | $20,734 | $68,225 |
| 2013 | -- | $87,104 | $20,413 | $66,691 |
Source: Public Records
Map
Nearby Homes
- 1811 Mason Corte Dr
- Lot 37 Margaret Ct
- 2102 Truman Trail
- 1718 W Lincoln Rd
- 1406 W Lincoln Rd
- 4406 Gray Wolf Cir
- 3905 Riverside Dr
- 3907 Riverside Dr
- 3301 Bergamot Path
- 0000 Fairview Ave
- 2413 Country Ln
- 2916 Oakwood Ave
- 3118 N Chapel Hill Rd
- 3114 Chapel Hill Rd
- 1731 Redwood Ln
- 1515 N River Rd
- 2813 Regner Rd
- 1804 Redwood Ln
- 1423 N River Rd
- 3019 W Lincoln Rd
- 1818 Julia Way
- 1902 Julia Way
- 1901 Anthony Ln
- 1817 Anthony Ln
- 1909 Anthony Ln
- 1801 Anthony Ln
- 1906 Julia Way
- 1915 Anthony Ln
- 1907 Margaret Ct
- 1914 Julia Way
- 1814 Margaret Ct
- 1711 Anthony Ln
- 1904 Anthony Ln
- 1919 Anthony Ln
- LOT 30 Julia Way Dr
- LOT 1-3 Julia Way
- Lot 26 Julia Way
- 1790 Anthony Ln
- 1918 Julia Way
- Lot 26 Julia Way