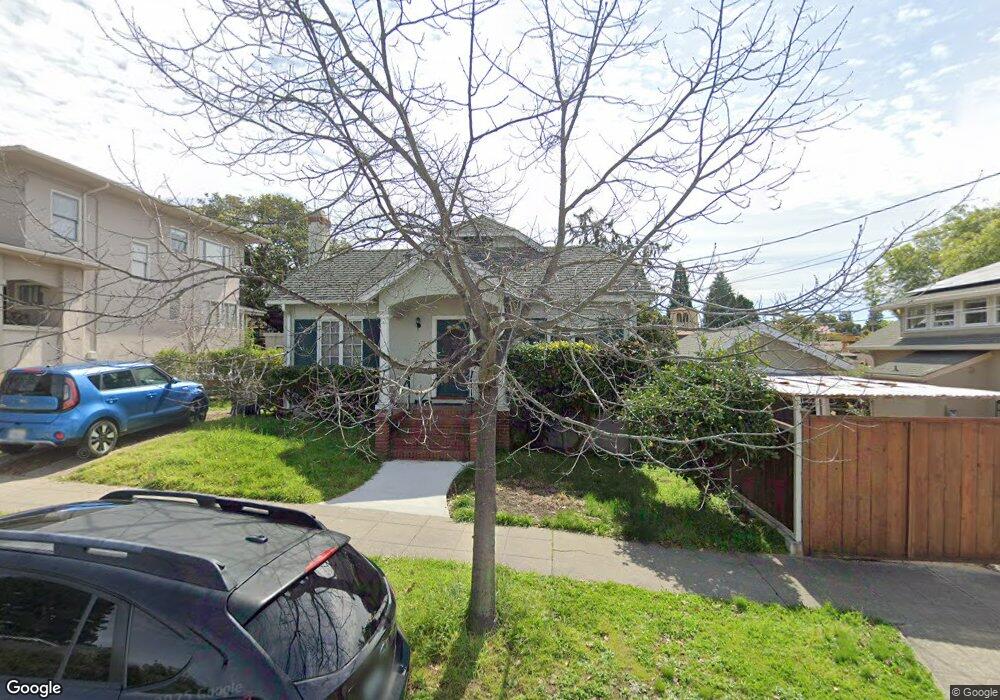
1812 Tacoma Ave Berkeley, CA 94707
Thousand Oaks NeighborhoodEstimated Value: $1,510,250 - $1,704,000
2
Beds
1
Bath
1,382
Sq Ft
$1,173/Sq Ft
Est. Value
About This Home
This home is located at 1812 Tacoma Ave, Berkeley, CA 94707 and is currently estimated at $1,621,313, approximately $1,173 per square foot. 1812 Tacoma Ave is a home located in Alameda County with nearby schools including Thousand Oaks Elementary School, Ruth Acty Elementary, and Berkeley Arts Magnet at Whittier School.
Ownership History
Date
Name
Owned For
Owner Type
Purchase Details
Closed on
May 14, 2020
Sold by
Brodie Michael S
Bought by
Maggio Elizabeth D
Current Estimated Value
Home Financials for this Owner
Home Financials are based on the most recent Mortgage that was taken out on this home.
Original Mortgage
$297,000
Outstanding Balance
$263,183
Interest Rate
3.3%
Mortgage Type
New Conventional
Estimated Equity
$1,358,130
Purchase Details
Closed on
Apr 13, 2001
Sold by
Brown Susanna L and Estate Of George M Kober
Bought by
Brodie Michael S and Maggio Elizabeth D
Home Financials for this Owner
Home Financials are based on the most recent Mortgage that was taken out on this home.
Original Mortgage
$420,000
Interest Rate
6.87%
Create a Home Valuation Report for This Property
The Home Valuation Report is an in-depth analysis detailing your home's value as well as a comparison with similar homes in the area
Home Values in the Area
Average Home Value in this Area
Purchase History
| Date | Buyer | Sale Price | Title Company |
|---|---|---|---|
| Maggio Elizabeth D | -- | Old Republic Title Company | |
| Brodie Michael S | $525,000 | Chicago Title Co |
Source: Public Records
Mortgage History
| Date | Status | Borrower | Loan Amount |
|---|---|---|---|
| Open | Maggio Elizabeth D | $297,000 | |
| Closed | Brodie Michael S | $420,000 | |
| Closed | Brodie Michael S | $52,450 |
Source: Public Records
Tax History
| Year | Tax Paid | Tax Assessment Tax Assessment Total Assessment is a certain percentage of the fair market value that is determined by local assessors to be the total taxable value of land and additions on the property. | Land | Improvement |
|---|---|---|---|---|
| 2025 | $12,095 | $784,032 | $237,309 | $553,723 |
| 2024 | $12,095 | $768,524 | $232,657 | $542,867 |
| 2023 | $11,843 | $760,320 | $228,096 | $532,224 |
| 2022 | $11,629 | $738,415 | $223,624 | $521,791 |
| 2021 | $11,655 | $723,800 | $219,240 | $511,560 |
| 2020 | $11,029 | $723,307 | $216,992 | $506,315 |
| 2019 | $10,594 | $709,127 | $212,738 | $496,389 |
| 2018 | $11,053 | $695,225 | $208,567 | $486,658 |
| 2017 | $10,045 | $681,596 | $204,479 | $477,117 |
| 2016 | $9,722 | $668,235 | $200,470 | $467,765 |
| 2015 | $9,593 | $658,202 | $197,460 | $460,742 |
| 2014 | $9,525 | $645,313 | $193,594 | $451,719 |
Source: Public Records
Map
Nearby Homes
- 1858 San Lorenzo Ave
- 1983 Yosemite Rd
- 753 Peralta Ave
- 765 San Diego Rd
- 1741 Sonoma Ave
- 491 Vincente Ave
- 813 San Diego Rd
- 1498 Sonoma Ave
- 415 Berkeley Park Blvd
- 589 San Luis Rd
- 1950 Hopkins St
- 758 Spruce St
- 483 Boynton Ave
- 938 San Benito Rd
- 450 Vermont Ave
- 777 Cragmont Ave
- 1036 Ramona Ave
- 118 Ramona Ave
- 840 Key Route Blvd
- 1266 Washington Ave
- 1818 Tacoma Ave
- 849 Colusa Ave
- 851 Colusa Ave
- 1822 Tacoma Ave
- 1817 San Pedro Ave
- 853 Colusa Ave
- 1821 San Pedro Ave
- 1826 Tacoma Ave
- 1811 San Pedro Ave
- 1827 San Pedro Ave
- 1805 Tacoma Ave
- 1815 Tacoma Ave
- 1819 Tacoma Ave
- 855 Colusa Ave
- 1830 Tacoma Ave
- 1825 Tacoma Ave
- 1831 San Pedro Ave
- 811 Colusa Ave
- 1829 Tacoma Ave
- 1834 Tacoma Ave
Your Personal Tour Guide
Ask me questions while you tour the home.