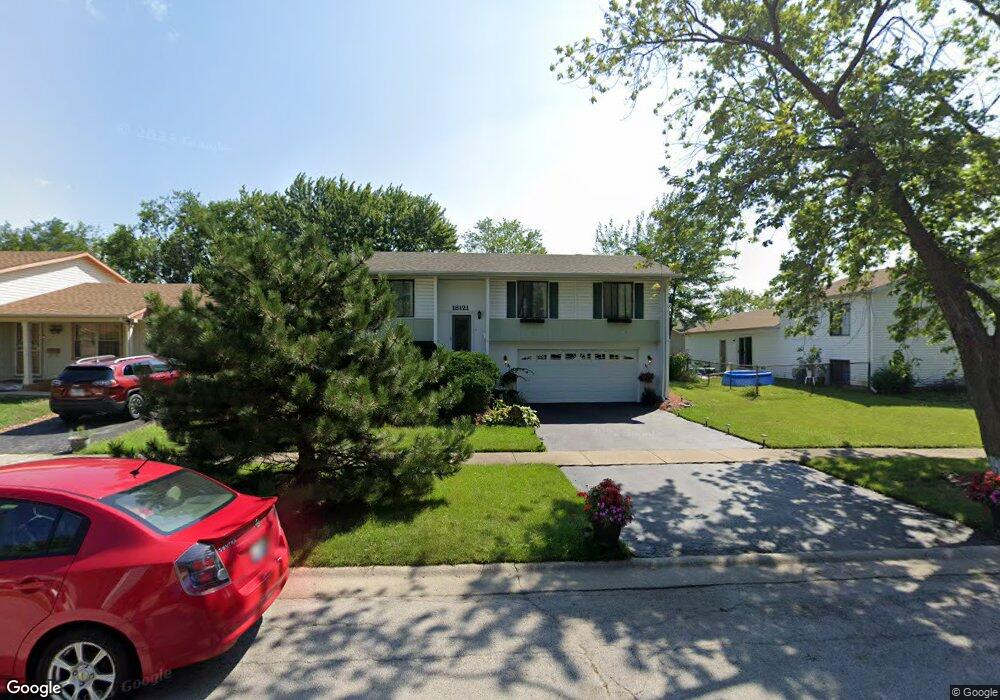
18121 Orleans Dr Hazel Crest, IL 60429
Chateaux-Versailles NeighborhoodEstimated Value: $182,000 - $250,000
3
Beds
2
Baths
954
Sq Ft
$217/Sq Ft
Est. Value
About This Home
This home is located at 18121 Orleans Dr, Hazel Crest, IL 60429 and is currently estimated at $207,019, approximately $217 per square foot. 18121 Orleans Dr is a home located in Cook County with nearby schools including Chateaux School, Prairie-Hills Junior High School, and Hillcrest High School.
Ownership History
Date
Name
Owned For
Owner Type
Purchase Details
Closed on
Nov 21, 2006
Sold by
Roscoe Janice and Roscoe Ronald
Bought by
Corn Ladonna and Terrell Corn Ladonna
Current Estimated Value
Home Financials for this Owner
Home Financials are based on the most recent Mortgage that was taken out on this home.
Original Mortgage
$120,000
Outstanding Balance
$81,264
Interest Rate
8.95%
Mortgage Type
Balloon
Estimated Equity
$125,755
Purchase Details
Closed on
Aug 12, 1997
Sold by
Bank Of America Natl Trust & Svgs Assn
Bought by
Roscoe Ronald and Roscoe Janice
Home Financials for this Owner
Home Financials are based on the most recent Mortgage that was taken out on this home.
Original Mortgage
$63,000
Interest Rate
7.42%
Purchase Details
Closed on
Aug 9, 1991
Sold by
Va
Bought by
Roscoe Janice
Home Financials for this Owner
Home Financials are based on the most recent Mortgage that was taken out on this home.
Original Mortgage
$150,000
Interest Rate
7.54%
Create a Home Valuation Report for This Property
The Home Valuation Report is an in-depth analysis detailing your home's value as well as a comparison with similar homes in the area
Home Values in the Area
Average Home Value in this Area
Purchase History
| Date | Buyer | Sale Price | Title Company |
|---|---|---|---|
| Corn Ladonna | $160,000 | Residential Title Services | |
| Roscoe Ronald | -- | -- | |
| Roscoe Janice | $55,000 | -- |
Source: Public Records
Mortgage History
| Date | Status | Borrower | Loan Amount |
|---|---|---|---|
| Open | Corn Ladonna | $120,000 | |
| Previous Owner | Roscoe Ronald | $63,000 | |
| Previous Owner | Roscoe Janice | $150,000 |
Source: Public Records
Tax History Compared to Growth
Tax History
| Year | Tax Paid | Tax Assessment Tax Assessment Total Assessment is a certain percentage of the fair market value that is determined by local assessors to be the total taxable value of land and additions on the property. | Land | Improvement |
|---|---|---|---|---|
| 2024 | $5,140 | $16,000 | $2,520 | $13,480 |
| 2023 | $5,490 | $16,000 | $2,520 | $13,480 |
| 2022 | $5,490 | $10,900 | $2,160 | $8,740 |
| 2021 | $5,355 | $10,899 | $2,160 | $8,739 |
| 2020 | $5,238 | $10,899 | $2,160 | $8,739 |
| 2019 | $3,826 | $9,144 | $1,980 | $7,164 |
| 2018 | $3,704 | $9,144 | $1,980 | $7,164 |
| 2017 | $3,497 | $9,144 | $1,980 | $7,164 |
| 2016 | $3,310 | $8,158 | $1,800 | $6,358 |
| 2015 | $3,100 | $8,158 | $1,800 | $6,358 |
| 2014 | $3,054 | $8,158 | $1,800 | $6,358 |
| 2013 | $2,449 | $7,743 | $1,800 | $5,943 |
Source: Public Records
Map
Nearby Homes
- 18120 Versailles Ln
- 3400 Seine Ct
- 18106 Charlemagne Ave
- 3406 Seine Ct
- 3255 183rd St
- 3411 Montmarte Ave
- 3525 Marseilles Ln
- 3407 Fountainbleau Dr
- 18107 Kedzie Ave
- 3068 Hickory Rd
- 3360 184th St Unit 3W
- 17910 Millstone Rd
- 3112 Shagbark Ln
- 3114 Shagbark Ln
- 17922 Normandy Ln
- 18108 Fountainbleau Dr
- 18445 Kedzie Ave
- 3240 Knollwood Ln
- 18208 Fountainbleau Dr
- 18018 Chantilly Ln Unit S3
- 18119 Orleans Dr
- 18123 Orleans Dr
- 18117 Orleans Dr
- 18122 Versailles Ln
- 18124 Versailles Ln
- 18120 Versailles Ln
- 18118 Versailles Ln
- 18115 Orleans Dr
- 18118 Orleans Dr
- 18120 Orleans Dr
- 18116 Orleans Dr
- 18114 Orleans Dr
- 18116 Versailles Ln
- 18113 Orleans Dr
- 18112 Orleans Dr
- 18114 Versailles Ln
- 18121 Charlemagne Ave
- 18119 Charlemagne Ave
- 18117 Charlemagne Ave
- 18112 Versailles Ln